By Matt Walker
This report reviews the growth and development of the webscale network operator (WNO) market. On an annualized (12 month) basis through 1Q22, webscalers represent $2.19 trillion (T) in revenues, $229 billion (B) in R&D spending, and $185B in capex, and had $670B of cash and short-term investments on the books as of March 2022.
Introduction
Webscale sector revenues grew 9.5% YoY in 1Q22, to $538.6B. This growth rate would be stellar in virtually any other industry sector, but represents a step down for webscalers. On an annualized basis, revenues through 1Q22 increased by 18.6% to reach $2.185T. All key webscalers saw revenue growth rates fall in 1Q22 sequentially, but weaker growth at Alphabet, Amazon, Apple, and Facebook (Meta) had the biggest impact on the slower industry growth. This is significant because the revenue drivers for the four companies are quite different. A weaker economic climate, inflation, and supply chain constraints were all contributors to 1Q22’s disappointment.
Webscale capex continues to surge, despite slower revenue growth. Capex in 1Q22 was $47.0B, up 27.4% from 1Q21. That pushed the sector’s annualized capital intensity to 8.5%, from 8.2% in 4Q21. Annualized webscale capex hit $185 billion in 1Q22, up 30% YoY, and is nearly 60% as much as telecom sector capex. While telcos spend at most 1-2% of revenues on R&D, webscalers’ R&D spend for the 1Q22 annualized period amounted to 10.5% of revenues. Large portions of this R&D are network-related, as the biggest webscalers have bleeding-edge requirements for the technology they deploy in their network. That has led them to drive the creation of many new innovations in network infrastructure over the last few years. These span semiconductors, optical transmission and components, intent-based routing, network automation, and other areas.
The Americas powered 1Q22 growth, with Europe lagging
In 2021, revenue growth was strongest in the Asia Pacific region, but the Americas drove 1Q22 growth. Revenues were up 13.1% in 1Q22 in the Americas and 8.7% in MEA, but just 6.8% and 6.7% for Asia and Europe, respectively. The war in Ukraine was a factor in Europe, and a slowdown in China’s tech sector was a factor in Asia results. With the solid 1Q22 result, the Americas now account for 43.8% of global webscale revenues, followed by 36.1% for Asia, 17.3% for Europe, and 2.8% for MEA. On the capex front, the Americas account for the majority of the global market, with the US at the center. For instance, both Alphabet and Facebook (Meta) say well over 70% of their “long-lived assets” are in the US. Going forward, the non-US portion should rise as the cloud providers within the webscale market build out their global data center footprints. Google Cloud regions under development, for instance, include Doha, Paris, Milan, Madrid, Turin, Berlin, Damman (KSA), and Tel Aviv, in addition to new US regions in Columbus (Ohio) and Dallas (Texas).
Free cash flow and net margins dropping but cash reserves remain relatively healthy
As revenue growth rates have fallen, profit margins have also tightened in the webscale sector. Free cash flow, defined as cash from operations less capex, amounted to 15.3% of revenues for the 1Q22 annualized period. That’s down from 19.6% in 1Q22. The margin is still comfortable relative to many other sectors, though. Net profits as a percentage of revenues were 18.3% for 2Q21-1Q22, a bit down from recent quarters. The dip is mainly due to one-time factors at several companies, most of which related to write-downs on the value of investments.
Despite reduced profit margins, the webscale sector retains a healthy cash horde, with cash & short-term investments measuring $670.1B in March 2022, from $739.5B a year earlier. Webscalers’ total debt climbed from 1Q20 to 1Q21, but the sector’s net debt position is still comfortably negative. Several individual companies, though, do have more debt than cash. However, the fact that Apple is the biggest such company is an indicator that more debt than cash is not necessarily a negative for a well-managed company with a strong market position. Meanwhile, the stock of Facebook has been hit hard in the last few months despite its lack of any debt at all; there is a concern that the company is losing ad share to TikTok and may be spending too much to pursue the “metaverse.”
Top three cloud providers plus Facebook (Meta) account for over 68% of industry capex
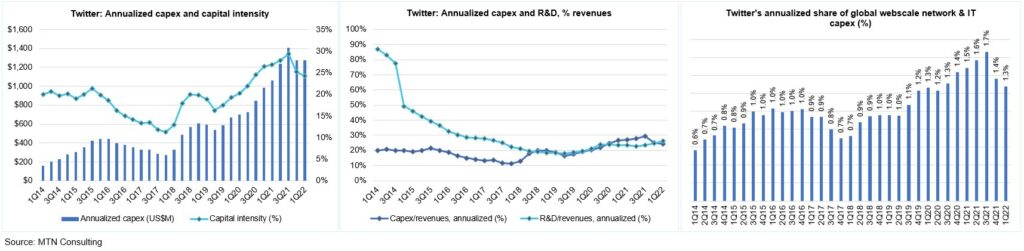
This webscale tracker considers a “Top 8” group of companies as being, traditionally, the most influential in the market’s overall technology development and investments. These include three Chinese Internet companies (Alibaba, Baidu and Tencent), the world’s leading smartphone provider (Apple), the world’s biggest social media company (Facebook), and the leading three cloud providers: Alphabet, Amazon, and Microsoft. Ranking webscalers based on their share of tech capex, Amazon tops the list easily, accounting for 26.6% of annualized network/IT capex in 1Q22. Amazon is followed by Alphabet (16.2%), Microsoft (13.6%), Facebook (12.2%), Tencent (5.6%), Apple (4.4%), Alibaba (4.3%), Oracle (3.3%), Baidu (1.9%), IBM (1.5%), HPE (1.4%), and Twitter (1.3%). Amazon’s recent capex surge is well known, and has supported expansion of the company’s AWS footprint and service offerings. Oracle has been quieter but its capex growth is equally impressive, from a smaller base: its capex spend as a percent of revenues was 9.1% for the 1Q22 annualized period, from just 4.7% in 1Q21. Twitter, a new addition to our webscale coverage, spends more on network/IT capex as a percentage of revenues (nearly 19%) than all other webscalers, due to ongoing software development and construction of its first owned data center.
The facilities these webscale players are building can be immense, and spread across large campuses. Facebook (Meta), for instance, is currently adding three new buildings to its Mesa, Arizona data center campus, bringing the total square footage to 2.5 million; it is also adding three new buildings to its DeKalb, Illinois campus, bringing total to 2.4 million. The cost of each one of these expansion projects is roughly US$1 billion. Further, webscalers are spending tens of millions of US dollars to buy land in data center hotspots like northern Virginia and San Jose, to build new facilities. Microsoft, for instance, purchased land in San Jose last year for $78M and is planning two new data centers on the plot.
Who benefits from webscale capex?
The network spending of big webscalers is centered around immense, “hyperscale” data centers and undersea cable systems that support network traffic from the tech companies’ online retail, video, and social media platforms, along with cloud services. Webscale network operators (WNOs) may also own access networks, typically using fiber, microwave or mmWave, and even fixed satellite. WNOs exploring outer space for providing connectivity include Amazon, Apple, Alphabet, Facebook, and Microsoft.
A broad set of vendors are benefiting from WNO capex spending – from semiconductor players selling into the data center market (Intel, AMD, Nvidia, Broadcom, etc), to optical components & transport vendors selling into data center interconnect markets (e.g. Infinera, II-VI, Lumentum/Neophotonics), to contract manufacturers of white box/OCP servers (e.g. Wistron and Quanta). Cisco, for instance, recorded approximately $4.0B in 2021 sales to the webscale sector, up from about $2.1B in 2020. The construction industry also sees webscale as important, as much of their capex is for development of data center properties.
Network investment outlook
Our current forecast calls for $187B of webscale capex in 2022, and further growth in the out-years until capex hits about $252B in 2026. For now, we are maintaining these targets. Despite a modest slippage in profitability, cash/debt and top-line growth in 1Q22, the sector retains many strengths which won’t go away overnight. Cloud services revenue growth remains strong, as does profitability for most players. Moreover, 2022 capex guidance from the major webscalers on recent earnings call suggests modest growth:
- Amazon: on 1Q22 earnings call, it said the infrastructure (AWS plus Consumer) investments would grow YoY in 2022, “in large part to support the rapid growth and innovation we’re seeing within AWS” and estimated that infra would be about half of total company capex (including finance leases) for the year.
- Alphabet: continues to project a “meaningful increase in capex” for 2022. The big growth recorded in 1Q22 was largely due to land purchases (New York, London, and Poland), but the rest of year would be driven by “technical infrastructure globally with servers as the largest component.”
- Microsoft: for 2Q22, company expects “a sequential increase on a dollar basis as we continue to invest to meet growing global demand for our cloud services.”
- Facebook (Meta): still expects 2022 capex, including principal payments on finance leases, to be in the range of $29-34B, significantly up from 2021. “It’s true we are investing significantly in AI and machine learning investments to power ranking and recommendations for things like Ads, Reels and Feed. And so that does add to the CapEx intensity of the business. And we do think there is additional capital intensity of the business as we make significant investments in AI and machine learning on top of just additional capacity growth. We’re not sharing an outlook beyond 2022 at this point.”
- Oracle: spending $1B/quarter through current fiscal year (ended May 2022), no guidance beyond.
- Twitter: guidance from 4Q21 call was for flat capex in 2022 but a decline seems likely given distractions from the Elon Musk-driven acquisition
- Tencent, Alibaba, Baidu, and JD.Com: have not provided capex guidance recently. Actual 2022 spend depends heavily on Chinese government tech sector restrictions and COVID-related shutdowns. Tencent is one to watch, though, as it has hinted at Facebook-like investments in the “metaverse,” says it has a lot of the building blocks needed, for example, “a lot of gaming experiences…very strong social networking experience…engine capability, we have AI capability, we have the capability to build a large server architecture that can serve a huge number of concurrent users. We are very experienced in managing digital content economies as well as real-life digital assets.”
For clients, we will be providing a formal mid-year update to our network operator forecast within the next 2 months.
Implications for carrier-neutral market segment
Webscalers with cloud operations are building out their data center footprints, and most webscalers are deploying more complex functionality into their networks (video, gaming, AI, metaverse). However, webscalers do have some financial pressures, and more important have an increasingly rich range of options for how they expand. The carrier-neutral segment (CNNO) of data center players is investing heavily in larger, more hyperscale-friendly and energy efficient facilities. Further, the sector is consolidating with help from private equity. MTN Consulting expects webscalers to continue to lean heavily on these third-parties for expansion in 2022 and beyond. As a result, data center CNNOs like Digital Realty, Equinix and its JV partners, QTS/Blackstone, CyrusOne/KKR/GIP, American Tower/CoreSite, and GDS will become more attractive to vendors as they invest more in network technology of their own.
- Table Of Contents
- Figures & Charts
- Coverage
- Visuals
Table Of Contents
- Abstract
- Analysis
- WNO Market: Key Stats
- Company Drilldown
- Top 8 WNOs
- Company Benchmarking
- Regional Breakouts
- Raw Data
- Exchange Rates
- About
Figures & Charts
- Key Metrics: Growth rates, Annualized 1Q22/1Q21 vs. 2011-21
- WNO Revenues: Single-quarter & annualized (US$M)
- Top 8 WNOs: YoY revenue growth in 1Q22
- Annualized profitability: WNOs
- Free cash flow per employee, 1Q22 annualized (US$)
- FCF Margins vs. Net Margins, 1Q22 annualized
- Advertising revenues as % total (FY2021)
- Annualized capex and R&D spending: WNOs (% revenues)
- WNO capex by type, Annualized: 1Q15-1Q22 (US$M)
- Network & IT capex as share of revenues, 1Q22 annualized
- R&D expenses as % revenues, Top 8 WNOs (1Q22 annualized)
- Acquisition spending vs. capex spending, 1Q15-1Q22 annualized (US$M)
- Net PP&E per employee (US$’ 000) – 1Q22
- Ranking the Webscale Network Operators: Revenues; R&D; Capex; Network & IT capex – 2021 & 1Q22 (US$B)
- Revenues: annual, single-quarter, and annualized (US$M)
- Profitability (Net Profit; Cash from operations; Free cash flow): annual, single-quarter, and annualized (US$M)
- Spending (R&D; M&A; Capex; Network & IT capex; Lease): annual, single-quarter, and annualized (US$M)
- Cash & Short-term Investments: annual and single-quarter (US$M)
- Debt (Total debt; Net debt): annual and single-quarter (US$M)
- Property, Plant & Equipment: annual and single-quarter (US$M)
- Key Ratios: Net margin; R&D/revenues; Capex/revenues; Network & IT capex/revenues; Free cash flow/revenues; Lease costs/revenues – annual and annualized (%)
- Total employees
- Revenue per employee, annualized (US$K)
- FCF per employee, annualized (US$K)
- Net PP&E per employee, annualized (US$K)
- Revenues & Spending (US$M)
- Webscale Business Mix by Revenues (FY2021) – MTN Consulting estimates
- Top 10 recent acquisitions & investments
- Revenues (US$M) & YoY revenue growth (%), single-quarter: by company
- Revenues, annualized (US$M): by company
- Annualized profitability margins: by company
- Annualized capex and capital intensity: by company
- Annualized capex and R&D spending as % of revenues: by company
- Share of WNO network & IT capex, Annualized: by company
- Total employees: by company
- Annualized per-employee metrics (US$000s): by company
- Net debt (debt minus cash & stock) (US$M): by company
- 2011 vs. 2021: company benchmark by KPI (Revenues, R&D, Net profit, Cash from operations, Capex, Free cash flow, Cash & short-term investments, Net PP&E, Total debt)
- 2011 vs. 2021: company benchmark by key ratio (Capex/revenues; R&D/revenues; Net margin; FCF margin)
- Top 8 WNO’s share vs. Rest of the market: by KPI (Revenues, R&D, Net profit, Cash from operations, Capex, Free cash flow, Cash & short-term investments, Net PP&E, Total debt)
- Top 8 WNOs benchmarking by Key ratio: Capex/revenues; R&D/revenues; Net margin; FCF margin)
- Total WNO Market Revenues, by region: Latest CY; Latest Quarter; Annual trend (2011-20); Single quarter (1Q14-1Q22)
- Regional revenues by operator: Latest CY; Latest Quarter; Annual trend (2011-20); Single quarter (1Q14-1Q22)
- Top 10 operators by region: Latest CY; Latest Quarter
Coverage
| Top 8 WNOs | |||
| Alibaba | Alphabet | Amazon | Apple |
| Baidu | Microsoft | Tencent | |
| Other WNOs | |||
| Altaba | ChinaCache | Cognizant | eBay |
| Fujitsu | HPE | IBM | JD.com |
| Oracle | SAP | ||
| Yandex | |||
Visuals