By Matt Walker
This report reviews the growth and development of the webscale network operator (WNO) market since 2011. In the most recent 12 months (3Q22-2Q23), webscalers represented $2.28 trillion (T) in revenues (+3.3% YoY), $285 billion (B) in R&D spending (+18.2% YoY), and $196B in capex (+1.3% YoY). They had $669B of cash and short-term investments (+5.8% YoY) on the books as of June 2023, and $546B in total debt (+5.4% YoY). Webscalers employed approximately 4.07 million (M) people at the end of 2Q23, unchanged from June 2022 but up substantially from the 2.96 million employed three years prior, in June 2020.
Revenues up 6% YoY in 2Q23, to $567B
The webscale market skyrocketed during COVID. In 1Q20, when COVID first emerged, annualized revenues were just under $1.5 trillion. Just 6 quarters later, in 3Q21, the sector reached the $2 trillion mark. This stunning growth moderated in 2022 due to macroeconomic issues (inflation, higher interest rates), weak ad sales, and China’s slow growth and ongoing constraint of the tech sector. The market is picking up again in 2023, however, as 2Q23 annualized revenues hit $2.279 trillion, up 3% YoY. On a single quarter basis, webscale revenues were $566.6 billion in 2Q23, up 5.9% YoY.
By company, all of the top 8 webscalers saw positive growth in their single quarter revenues in 2Q23, with the big exception of Apple. Its revenues are cyclical, though, and impacted by device refreshes and upgrade cycles; the company’s overall growth trajectory is positive and profit margins are good. Meta (FB) and Amazon both saw roughly 11% growth in revenues in 2Q23, the best results among the top 8 group. China’s three webscalers also saw revenue growth of at least 5% YoY, as their prospects start to stabilize.
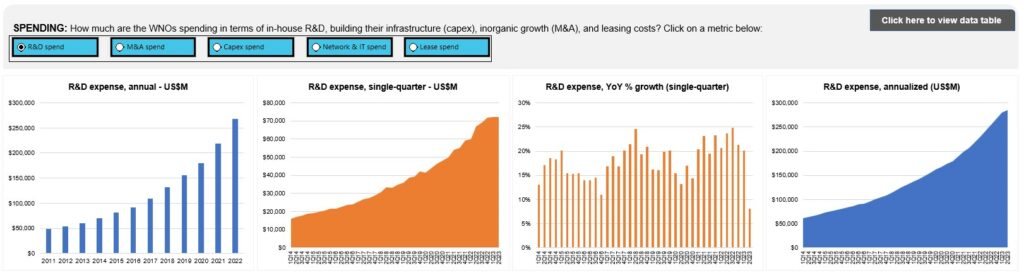
Technology spending: R&D continues to surge, capex returns to positive growth
In 2Q23, webscalers spent $44.1B and $72.3B on capex and R&D, respectively. For capex, the result represents a 9% YoY dip, and the second straight quarter of negative growth. Growth rates are likely to turn positive in the second half, based on official guidance and economic trends, but the sector does have some capacity to digest. For R&D, spending was up 8.1% YoY in 2Q23, which is a slowdown relative to recent quarters: the previous 6 quarters saw YoY growth of at least 20%. R&D as a share of revenues has climbed as a result, to 12.5% (annualized). Some of this growth in R&D intensity is due to weak revenues, but some due to webscaler interest in exploiting advances in AI, both across their operations (e.g. by redesigning data centers) and in services (e.g. generative AI tools).
The tech portion of capex (“Network, IT and software”) has grown as a % of total recently, but other capex (mostly related to land & buildings) is still comfortably over 50% of total. For the four quarters ended 2Q23, Network/IT/software accounted for $91B of the $196B total.
From a separate MTN Consulting study, we found that energy consumption by webscalers in 2022 grew about 16% YoY, to 136.6 terawatt hours (TWh). That growth exceeds the 3% and 7% recorded by the telco & carrier-neutral sectors, respectively. Webscale energy consumption is driven primarily by the sector’s installed base of data centers, which has expanded dramatically in the last 3 years: net PP&E on the books totaled $475B in 2Q20, and reached $657B just three years later in 2Q23.
US accounts for over 50% of webscale capex
This report series traditionally breaks out revenues by region for each webscaler. With this edition of the report, we are adding our first regional breakout of capex, focused on the US. Our analysis finds that the US has amounted to between 50-60% of global webscale capex for most of the last decade. This percentage increased in the last two years, ending 2022 at an incredible 65%. Some of this growth is due to a capex surge by US-centric Amazon in 2021-22. We don’t expect this dominance by the US to continue. The ratio is likely to return below 50% soon as webscalers expand their footprints in other regions. Spending pickups by China-based cloud providers will be one driver of this moderation.
Webscale market compared to telecom
A decade ago, the webscale sector did not exist. Big tech companies were just beginning to build their own data centers to optimize their cost structure, operational efficiency, and time to market. But webscale capex was a rounding error in the overall market for network infrastructure. That’s not the case anymore. Webscale capex surpassed $200B for the first time in 2022. Annualized webscale capex has since fallen below $200B, but that is a short-term blip.
Telco capex is still higher, and will remain so for the next few years. But, webscale capex is far more concentrated, as it is dominated by a few big spenders, and it is focused on a smaller range of product types and vendors. Some aspects of webscale capex are more leading edge; innovations in the data center often impact other types of networks (e.g. high-speed optics for telco backbone networks). As such, the market will continue to be important for lots of vendors – and not just chip suppliers.
Spending outlook
Here is a summary of the spending outlook for key webscalers:
Amazon: for CY2023 it expects capex plus equipment finance leases to total $50B, from ~$59B in 2022. Says the dip is due to declines in fulfillment and transport capex, while infra capex to support AWS is growing in 2023, “including additional investments related to generative AI and large language model efforts.”
Meta (FB): expects CY23 capex of $27-$30B, from an earlier range provide of $30-33B. Reduction due to “cost savings, particularly on non-AI servers, as well as shifts in CapEx into 2024 from delays in projects and equipment deliveries rather than a reduction in overall investment plans.” Expects capex to grow in 2024, driven by “investments across both data centers and servers, particularly in support of our AI work”.
Microsoft: expects capex in 3Q23 to increase sequentially on a dollar basis, driven by investments in AI infrastructure. Company says it will “continue to invest in our cloud and AI infrastructure while scaling with growing demand so we can lead the AI platform wave…”
Alphabet: notes that 2Q23 capex was less than expected, due in part to delays in certain data center construction projects. Company expects 2H23 capex to grow, though, and for that growth to continue into 2024. No hard numbers, though.
Oracle: its capex for the fiscal year ended May 2023 was $8.7B, from $4.5B the year prior. Plan for FY ending March 2024 is approximately the same capex. Oracle says its strategy is to build “many, many identical cloud regions… Our starting point is smaller, which allows us to go where competitors cannot and this continues to be an advantage for us.” It had 42 public cloud regions at end of May 2023, with another 7 under construction.
Apple: no capex guidance.
Tencent: no guidance, but comments that 2Q23 capex growth was due to increased investment in GPUs and servers.
Alibaba: no capex guidance, but company is bullish on cloud in general and AI specifically. In 2Q23, company says it saw “strong demand for model training and related AI services on cloud infrastructure, which were only partially fulfilled due to the near-term supply chain constraints globally,” and believes the “growth opportunity driven by AI services have just begun.”
Baidu: no guidance, but is bullish on its generative AI platform, ERNIE. Baidu says it is “empowering cloud customers to build their transformative products and services using ERNIE bot. In Q2, the number of corporates connecting to ERNIE bot continued to grow. Foundation models, large language models and generative AI are expanding our total addressable market…”
eBay: capex will remain in the 4-6% of revenue range.
IBM: no capex guidance, but notes that it has extended the assumed lives of servers and networking equipment. This change, which Meta and Alphabet also did recently, can lower depreciation costs and facilitate increases in capex, all else equal.
Forecast outlook
MTN Consulting’s latest forecast of network operator spending was published in July 2023. That forecast called for $218B in 2023 capex, and $222B in 2024. This forecast remains valid. We expect to revisit the forecast at the end of 4Q23.
- Table Of Contents
- Figures & Charts
- Coverage
- Visuals
Table Of Contents
- Abstract
- Analysis
- WNO Market: Key Stats
- Company Drilldown
- Top 8 WNOs
- Company Benchmarking
- Regional Breakouts
- Raw Data
- Exchange Rates
- About
Figures & Charts
- Key Metrics: Growth rates, Annualized 2Q23/2Q23 vs. 2011-22
- WNO Revenues: Single-quarter & annualized (US$M)
- Top 8 WNOs: YoY revenue growth in 2Q23
- Annualized profitability: WNOs
- Free cash flow per employee, 2Q23 annualized (US$)
- FCF Margins vs. Net Margins, 2Q23 annualized
- Advertising revenues as % total (FY2022)
- Annualized capex and R&D spending: WNOs (% revenues)
- WNO capex by type, Annualized: 2Q15-2Q23 (US$M)
- Network & IT capex as share of revenues, 2Q23 annualized
- R&D expenses as % revenues, Top 8 WNOs (2Q23 annualized)
- Acquisition spending vs. capex spending, annualized (US$M)
- Net PP&E per employee (US$’ 000) – 2Q23
- Ranking the Webscale Network Operators: Revenues; R&D; Capex; Network & IT capex – 2022 & 2Q23 (US$B)
- Annualized spending share for key webscalers since 2011 Capex: Network, IT and software
- Share of webscale spending by company, 2Q23 and 2Q22 annualized (Capex: Network, IT and software)
- Energy consumption vs. Net PP&E for key webscalers in 2022
- USA: Webscale capex total ($M) and % of global market, 2011-22
- Webscale vs. Telco Market: Annualized Capex (US$B)
- Webscale vs. Telco Market: Annualized capital intensity
- Revenues: annual, single-quarter, and annualized (US$M)
- Profitability (Net Profit; Cash from operations; Free cash flow): annual, single-quarter, and annualized (US$M)
- Spending (R&D; M&A; Capex; Network & IT capex; Lease): annual, single-quarter, and annualized (US$M)
- Cash & Short-term Investments: annual and single-quarter (US$M)
- Debt (Total debt; Net debt): annual and single-quarter (US$M)
- Property, Plant & Equipment: annual and single-quarter (US$M)
- Key Ratios: Net margin; R&D/revenues; Capex/revenues; Network & IT capex/revenues; Free cash flow/revenues; Lease costs/revenues – annual and annualized (%)
- Total employees
- Revenue per employee, annualized (US$K)
- FCF per employee, annualized (US$K)
- Net PP&E per employee, annualized (US$K)
- Revenues & Spending (US$M)
- Webscale Business Mix by Revenues (FY2022) – MTN Consulting estimates
- Top 10 recent acquisitions & investments
- Data center footprint
- Revenues (US$M) & YoY revenue growth (%), single-quarter: by company
- Revenues, annualized (US$M): by company
- Annualized profitability margins: by company
- Annualized capex and capital intensity: by company
- Annualized capex and R&D spending as % of revenues: by company
- Share of WNO network & IT capex, Annualized: by company
- Total employees: by company
- Annualized per-employee metrics (US$000s): by company
- Net debt (debt minus cash & stock) (US$M): by company
- 2011 vs. 2022: company benchmark by KPI (Revenues, R&D, Net profit, Cash from operations, Capex, Free cash flow, Cash & short-term investments, Net PP&E, Total debt)
- 2011 vs. 2022: company benchmark by key ratio (Capex/revenues; R&D/revenues; Net margin; FCF margin)
- Top 8 WNO’s share vs. Rest of the market: by KPI (Revenues, R&D, Net profit, Cash from operations, Capex, Free cash flow, Cash & short-term investments, Net PP&E, Total debt)
- Top 8 WNOs benchmarking by Key ratio: Capex/revenues; R&D/revenues; Net margin; FCF margin)
- Total WNO Market Revenues, by region: Latest CY; Latest Quarter; Annual trend (2011-22); Single quarter (2Q15-2Q23)
- WNO Market: Revenues, single-quarter (YoY % change)
- Regional revenues by operator: Latest CY; Latest Quarter; Annual trend (2011-22); Single quarter (2Q15-2Q23)
- Top 10 operators by region: Latest CY; Latest Quarter
Coverage
| Top 8 WNOs | |||
| Alibaba | Alphabet | Amazon | Apple |
| Baidu | Meta (FB) | Microsoft | Tencent |
| Other WNOs | |||
| Altaba | ChinaCache | Cognizant | eBay |
| Fujitsu | HPE | IBM | JD.com |
| Oracle | SAP | ||
| Yandex | |||
Visuals