By Matt Walker
This forecast spreadsheet details MTN Consulting’s forecast for revenues, capex, headcount, and other metrics across three segments of network operators: telecom operators (telcos), webscale network operators (webscalers), and carrier-neutral operators (CNNOs). In 2022, these three groups accounted for $4.1 trillion (T) in revenues, $559 billion (B) in capex, and 8.87 million employees. The report provides 2011-22 actuals and projections through 2027, and includes projections from past forecasts for reference.
Key changes since last forecast
Relative to the previous (12/22) forecast, there are a few changes in the results: a lower revenue growth trajectory, for both telcos and webscalers; faster headcount decline for telcos and a flattening of webscalers’ overall headcount; and, a slight reduction in overall projected capex. Total capex for the group came in at $559B in 2022, a few $B less than we expected. For the 2023-27 forecast period, we now expect capex to total $2,889 billion versus $3,005B in the 12/22 forecast. Of this new five-year capex total, the splits are unchanged: telcos account for 54.5% of the total, webscalers 38.2%, and CNNOs the final 7.3%.
Top line quantitative results
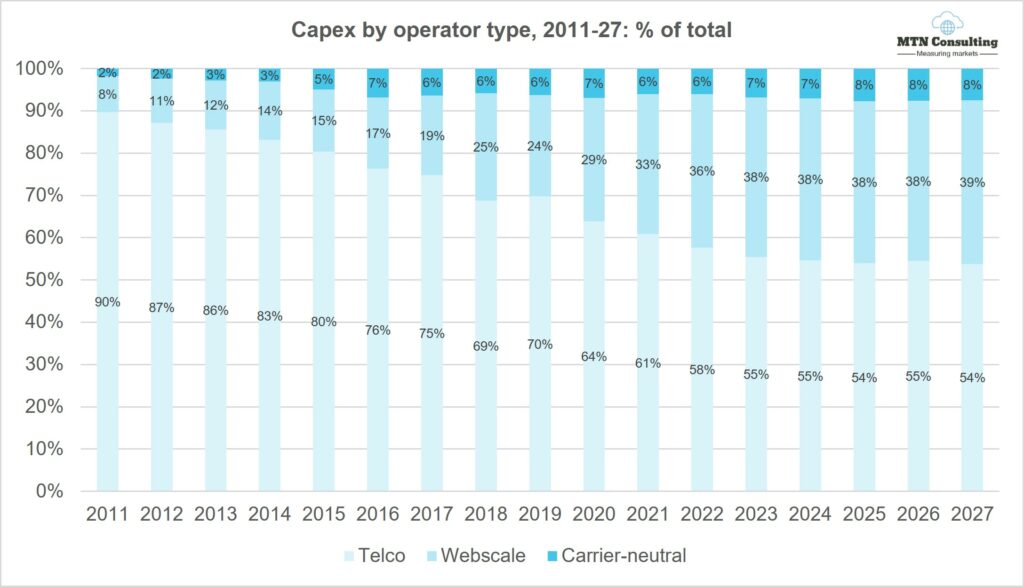
Revenues from the aggregate of our three segments – telco, webscale, and carrier-neutral – were $4,109 billion (B) in 2022, and will grow to $5,052B by 2027. Three segment capex ended 2022 at $559B, will step up to $577B in 2023, and will likely hit $596B in 2027. Webscale growth eased in 2022 but over the longer timeframe this sector accounts for most network operator growth. In 2011, webscale was less than 10% of capex, but had grown to 36.3% in 2022 and will be about 39% in 2027; CNNOs will represent 8% of 2027 capex, while telcos will constitute about 54%. Telco capital intensity peaked in 2022 at 18.1% amidst 5G buildouts but will end 2027 at about 16.5%. Regional variations will remain; the capex/revenue ratio for US telcos will average to 14.7% in 2023-27, for instance, while India will average 25.1%. Webscale capital intensity averages around 8% for the forecast period; a capex boom at Meta/Facebook has been a big plus in recent quarters, but spending from Microsoft and Alphabet related to AI (including new generative AI platforms) will also lift webscale capex in the next 1-2 years. Capital intensity is highest in carrier-neutral, as usual, well over 30% for the whole forecast period.
Headcount across the three operator segments has grown dramatically in the last decade, from 6.48 million in 2011 to 8.87M in 2022. That is roughly the same as the 2021 figure: telcos accelerated headcount reductions in 2022, and several webscalers announced layoffs. By 2027, headcount will grow to 9.1 million, but this is a sizable drop from the 10.2M we expected late last year. Automation and AI efforts will facilitate this more modest headcount expansion. Nearly all future growth is from webscale, with a good portion coming from the ecommerce side (e.g. Amazon, Alibaba, and JD.COM). Revenue per employee is highest in carrier-neutral, and will see the fastest growth during the forecast as data center-focused CNNO companies account for more growth. Telcos, though, will also grow revenue per employee from about $389K in 2022 to $467K in 2027 as they learn how to do more with less, implementing automation across their operations.
Network operator interdependence
The three groups of operators we track pursue a range of different business models, even within segments. Webscale revenue models revolve around a diverse mix of advertising, devices, software, cloud services, and ecommerce. Carrier-neutral providers, to simplify, rent network infrastructure to other businesses. Telcos sell subscription and pay-as-you-go services for communications services, including bandwidth, video, mobility, and enterprise services. There is a huge amount of variety in these discrete market segments. What’s more important, though, is that the three segments rely on each other in important ways. Carrier-neutral players get most of their revenues from telcos & webscalers needing to fill gaps in network coverage and accelerate time to market. Telcos rely on CNNOs to lower their cost of operations, and need webscalers to provide services and apps which make their network worth using beyond telephony. Webscalers lack last mile access networks and can only deliver their services to the mass market over telco infrastructure. Webscalers also, despite big capex outlays, can only blanket the globe with data centers by partnering with CNNOs for collocation.
This interdependence will grow. The big cloud providers in the webscale market, for instance, have targeted the telecom vertical and found success; AWS, Azure and GCP combined for about $5.0B in revenues from telcos for the latest annualized period (2Q22-1Q23), up 65% YoY. Telcos are making some big bets on cloud technology as they deploy 5G core networks. Both telcos and webscalers want to provide seamless, resilient network coverage, including at the edge, and can’t build it all themselves. As a result, they’ll need to scale up their partnerships with carrier-neutral players like Equinix and American Tower/CoreSite. CNNOs are increasingly taking over the “dumb pipe” aspects of the network, and to be competitive and upsell they will integrate assets across fiber, cell tower and data center.
Key findings by network operator type
This forecast includes detailed breakouts for each of the three network operator types. Here is a summary of some of the key findings, by segment:
Telcos: telecom is essentially a zero-growth industry. Specific countries and companies do grow from time to time, in part from market share shifts, the different timing of growth cycles, or M&A. But global telco revenues have hovered in a narrow range ($1.7-$1.9 trillion) since 2011, and this will likely remain true through 2027. In 2022, revenues were $1.78T, and will grow an average annual rate of 1.8% to reach $1.95T by 2027. Capex continues to vary with technology upgrade cycles (e.g. 5G) and government actions (e.g. newly issued spectrum, or rural fiber subsidies). In 2022, capex totaled $322B, or 18.1% of revenues; that’s an all-time high capital intensity, for our coverage timeframe (2011-present). Capex will decline slightly through 2025, though, and then rise modestly again to reach $321B in 2027, which would be a 16.5% capital intensity. US capex surged in 2022, but will drop dramatically in 2023; we already expected this, though, so the current forecast is not significantly different. Software capex is growing more slowly than expected, and now likely to remain under 20% of total capex for the forecast period. Headcount in telecom is declining faster than expected, and now likely to fall below 4.2 million in 2027, from just under 4.6 million in 2022. Labor costs per head will revert to a growth trajectory in 2023, as telcos develop a more IT/software-centric workforce.
Webscalers: growth from webscale has lifted the overall network operator market over the last decade. Webscalers surged during COVID, by all measures – revenues, capex, employment. Demand for data center chips and related gear also surged. Now, parts of the sector are cutting back slightly. In 2022, revenues were $2.23 trillion, up just 4% YoY, far less than the average growth of 12% per year from 2011-22. We expect revenues to grow at a ~6% CAGR through 2027. Webscale capex was $203B in 2022, a healthy increase from 2021; due in part to generative AI interest, capex will grow again in 2023 and 2024, dip for a couple years of capacity absorption, and then end 2027 at around $231B. A larger portion of this capex will be for Network/IT/software investments: around 46%, from 44% in 2022. R&D spending by webscalers will remain high but fall from the record-breaking level of 2022 (12.0% of revenues), to about 10% in 2027. As topline growth gets harder for webscalers, they will become more cost conscious and short-term oriented.
CNNOs: the carrier-neutral sector remains tiny, with just $95B in 2022 revenues, but will grow to about $132B by 2027. Webscalers and telcos alike will both rely more on CNNOs over time for expansion of their data center, tower and fiber footprints. Telcos will continue to spin out portions of their infrastructure to third-parties – both traditional CNNOs, and joint ventures like Gigapower, the AT&T-Blackrock partnership. Total CNNO capex for 2022 was $34B, and will grow to about $45B by 2027; a large chunk of the CNNO sector’s expansion will be inorganic, though, via acquisition of existing assets from other sectors. By 2027, the CNNO sector will have under its management approximately 3.7 million cell towers (2022: 3.3M), 1,607 data centers (2022: 1,224), and 1.1M route miles of fiber (2022: 960K).
Market drivers, constraints and risk factors
This forecast represents only a modest revision from the edition published in December 2022. Most of the realities facing the operator market today were anticipated by our last forecast. For instance, we already expected that service revenues were not growing for telcos, and that 5G device sales distorted the market; an MTN Consulting report published in 2Q23 confirmed this fact, and supports a more cautious outlook for telco spending. We also thought that open RAN was overhyped, and was not likely to change the capex calculus for most established mobile operators. The 2023 dip in US telco capex was baked into our old forecast. The one big sector-specific change from the last forecast to this one is, the recent spike in interest in generative AI. This is a plus for the webscale market’s capex outlook, even if new revenue models are unclear and government regulations will slow adoption.
What about the macroeconomic climate? Wars, economic growth, inflation, interest rates, climate change, etc. Russia’s war on Ukraine remains ongoing, but hasn’t expanded to new countries. China has not invaded Taiwan as of yet, although this is a serious risk over the 5-year forecast horizon. Global economic growth is weaker than historic averages – about 3% this year and next, per the IMF – but inflation is easing, and the IMF’s GDP growth outlook improved slightly from April to July 2023. Interest rates continue to rise; the US federal funds rate has risen from 3.83% to 5.08% between 12/22 and 7/23, and further increases seem likely. Rising interest rates were already assumed to modestly depress 2023-24 capex, though.
Climate change is the one macro area that is quite a bit different than 8 months ago. The news gets worse each week. Government action continues to be gradual and consensus is hard to achieve. Increasingly the pressure will be on private companies to make voluntary, verifiable changes in how they operate. This doesn’t impact the forecast directly, but will impact how operators spend their tech budgets, as we have discussed in separate reports. Energy, sustainability and climate change will continue to be key themes in MTN Consulting research.
- Table Of Contents
- Figures & Charts
- Coverage
- Visuals
Table Of Contents
Key sections include:
- Abstract
- Total Network Operator Market Projections
- TNO Projections
- TNO Regional Split Projections
- WNO Projections
- CNNO Projections
- Top spenders – spending outlook
- About
Figures & Charts
- Revenue by operator type, 2011-27 (US$B)
- Capex by operator type, 2011-27 (US$B)
- Capex by operator type, 2011-27: % of total
- Capital intensity by operator type, 2011-27
- Employees by operator type (M)
- Revenues/employee by operator type (US$K)
- Capex forecast by segment: July 2023 v. Dec. 2022 outlook, % difference
- Capex forecast by segment: July 2023 v. Dec. 2022 outlook, $B difference
- Top 50 spending operators, annualized 1Q23 capex ($B)
- Telcos: Revenues ($B) vs. capital intensity
- Software capex in US$B and as % of total capex
- Capital intensity variation: Telenor Norway vs global average
- Telco opex components: 2017, 2022 and 2027
- Telcos: Capex and network operations opex ($B)
- Telcos: Employees vs. average labor cost per employee ($K)
- Telcos: Labor cost opex in US$B and as % of Opex ex-D&A
- Telco margins, actual and forecast
- July 2023 vs. Dec 2022 forecast: % changes in key metrics
- Revenues by region: 2017, 2021, and 2027 (US$B)
- Telco capex by region, select years (US$B)
- Telcos: capital intensity by region
- Capex by region, % global
- Capex by region: July 2023 vs. Dec 2022 Forecast
- Capital intensity projections by forecast vintage
- Webscale revenues and capital intensity
- Webscale capital intensity by company HQ
- Webscale capex by company HQ (US$B)
- Webscale capex by type (US$B)
- Webscale R&D as % of revenues by company HQ
- Webscale revenue per employee ($K) by company HQ
- Percent change in outlook, July 2023 vs. Dec 2022 forecast
- China as a % of the global market, by metric (7/23 forecast)
- Carrier-neutral operators: Revenues and capital intensity
- CNNO employees and revenues per employee
- CNNO Towers and Tenancy Ratio, global ex-China
- Number of data centers and average net rentable floorspace (in square feet) per data center
- % difference in key metrics: July 2023 vs. Dec 2022 forecast
- CNNO capex by forecast vintage ($B)
- Capital intensity: 2011-22 by segment and 2023-27 average
- CNNO capex by segment, 2011-22 (US$B)
Coverage
Companies mentioned:
21Vianet
A1 Telekom Austria
Advanced Info Service (AIS)
Airtel
Alibaba
Alphabet
Altice Europe
Altice USA
Amazon
America Movil
American Tower
Apple
AT&T
Axiata
Axtel
Baidu
Balitower
Batelco
BCE
Bezeq Israel
Bharti Infratel
Bouygues Telecom
BSNL
BT
Cable ONE, Inc.
Cell C
Cellcom Israel
Cellnex
CenturyLink
Charter Comms
China Broadcasting
China Mobile
China Telecom
China Tower
China Unicom
ChinaCache
ChinData
Chorus Limited
Chunghwa Telecom
Cincinatti Bell
CK Hutchison
Cogeco
Cogent
Cognizant
Comcast
Consolidated Communications
CoreSite Realty
Crown Castle
Cyfrowy Polsat
CyrusOne
Cyxtera
DEN Networks Limited
Digi Communications
Digital Realty
Dish Network
Dish TV India Limited
DT
Du
eBay
EI Towers
Elisa
Entel
Equinix
Etisalat
Facebook
Far EasTone Telecommunications Co., Ltd.
Frontier Communications
Fujitsu
GDS Data Centers
Globe Telecom
Grupo Clarin
Grupo Televisa
GTL Infrastructure
GTT Communications
Hathway Cable & Datacom Limited
HPE
IBM
IHS Towers
Iliad SA
Internap
Inti Bangun Sejahtera
Inwit
JD.COM
KDDI
Keppel DC REIT
KPN
KT
Level 3
LG Uplus
Liberty Global
M1
Maroc Telecom
Maxis Berhad
Megafon
Microsoft
Millicom
Mobile Telesystems
MTN Group
MTNL
NBN Australia
NEXTDC
NTT
Oi
Omantel
Ooredoo
Oracle
Orange
PCCW
PLDT
Proximus
QTS Realty
Quebecor Telecommunications
Rakuten
Reliance Communications Limited
Reliance Jio
Rogers
Rostelecom
Safaricom Limited
SAP
Sarana Menara Nusantara
Sasktel
SBA Communications
Shaw
Singtel
SITI Networks Limited
SK Telecom
SmarTone
SoftBank
Solusi Tunas Pratama
Spark New Zealand Limited
StarHub
STC (Saudi Telecom)
Summit Digitel
Sunevision
Superloop
Swisscom
Switch
Taiwan Mobile
Tata Communications
Tata Teleservices
TDC
TDF Infrastructure/Arcus
TDS
Tele2 AB
Telecom Argentina
Telecom Egypt
Telecom Italia
Telefonica
Telekom Malaysia Berhad
Telenor
Telesites
Telia
Telkom Indonesia
Telkom SA
Telstra
Telus
Tencent
Thaicom
Tower Bersama Infrastructure
TPG Telecom Limited
True Corp
Turk Telekom
Turkcell
Twitter
Uniti Group
Veon
Verizon
Vodafone
Vodafone Idea Limited
VodafoneZiggo
Windstream
Yandex
Zain
Zain KSA
Zayo
Visuals