By Matt Walker
This report reviews the growth and development of the webscale network operator (WNO) market. In the most recent 12 months (2Q22-1Q23), webscalers represented $2.25 trillion (T) in revenues (+3% YoY), $280 billion (B) in R&D spending (+22% YoY), and $201B in capex (+7% YoY). They had $632B of cash and short-term investments (-5% YoY) on the books as of March 2023, and $549B in total debt (+6% YoY). Webscalers employed approximately 4.10 million (M) people at the end of 1Q23, down from 4.14M in March 2022 but up from 3.62M in March 2021.
Webscale revenue growth returns to positive territory in 1Q23, thanks to Amazon
Global webscale revenues totaled to $551.4B in 1Q23, up 2.4% YoY. This is an improvement from the zero YoY growth recorded in 4Q22, but weaker than the 4.5% growth recorded for CY2022 overall. Annualized (12 month) revenues through 1Q23 were $2,247M, up 2.8% YoY. Comparing 1Q23 revenues with 1Q22, Amazon delivered the most growth (sales up $10.9B YoY), while Alibaba, Apple, JD.Com and Fujitsu all recorded revenue drops in 1Q23.
The webscale market is in a holding pattern. Parts of it grew too fast during and soon after COVID, and now cutbacks are necessary. The Chinese government continues to worry about its webscalers getting too big, which has hit Alibaba and JD.Com, among others. There is more competition in the cloud services market. New rivals to established webscalers are popping up in various sectors. The biggest case is TikTok (ByteDance), whose success has directly hit growth at Meta (FB), but there are many others. Over the last 6 months, many webscalers have announced layoffs, and some are also rethinking capex plans. The macro climate has made all of this worse, as high inflation and rising interest rates slowed investment plans.
However, the webscale market has also gotten a boost in the last 6 months with the rapid takeoff of generative AI platforms like ChatGPT (partnered with Microsoft), Alphabet’s Bard, and Baidu’s ERNIE Bot. Business models to support these new platforms are nascent, but key webscalers see the platforms as opening up new use cases for their networks. There is more enthusiasm now for investing in advanced AI and data centers to accelerate the maturity of these new platforms. Webscalers have a history of spending early and rapidly to establish market positions and mindshare in new areas, and are content to worry about profitability later. That may happen with the new AI platforms. Alphabet, for instance, says it expects capex to step up each quarter of 2023, with AI at the center: “AI is a key component. It underlies everything that we do.” These AI platforms are about more than search; they also assist in content creation, data organization, and other areas. They have the potential to impact labor markets significantly. It’s hard to know how fast these will develop or what the mass market will ultimately use them for. But they are wildcards in the webscale market, and could contribute to the sector’s growth over the next few years.
Asia Pacific lagged other regions in 1Q23
Regionally, in 1Q23 the Americas, MEA and Europe all grew in the 3-4% YoY range. Asia Pacific revenues, however, were flat YoY, due largely to prolonged weakness at China’s biggest two ecommerce players, Alibaba and JD.Com. Tencent, by contrast, started to turn the corner in 1Q23 with a 2.7% YoY increase in revenue, after three straight quarters of decline. The China market will continue to be turbulent, as Alibaba is in the midst of a major restructuring (to include a spinoff of the cloud unit), and Chinese telcos and Huawei push into the cloud services markets.
Amazon is the single largest webscaler, by revenues, in the Americas and Europe, followed in both cases by Apple, Alphabet, Microsoft, and Meta (FB). In Asia, JD.Com, Apple, and Alibaba are the three largest, followed by Tencent and Amazon. Apple, Alphabet, and Amazon take the top three spots in the small MEA region.
Annualized capex has flattened for now but R&D spending continues to surge
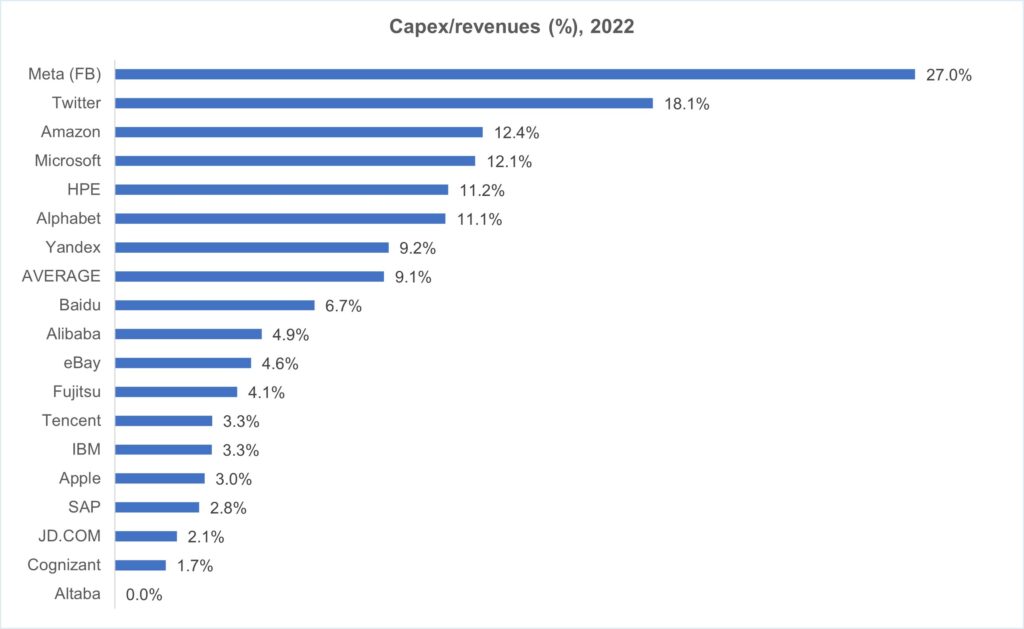
Capex and R&D spend as a % of revenues were both at all-time highs last quarter, in 4Q22. Capex spend moderated slightly in 1Q23, but R&D continued to surge ahead.
In $ terms, annualized capex was $200B in 1Q23, up from $188B in 2Q21-1Q22 but slightly down from CY2022. That’s because single quarter capex declined YoY in 1Q23, down 4% to $45.6B. The main culprits were Alphabet and Alibaba, as their capex dropped by $3.5B and $1.3B YoY, respectively. The tech (network/IT/software) portion of capex has been climbing, up from 41% of total annualized capex in 1Q22 to 45% in 1Q23. This may continue to grow, given Amazon and Alphabet’s spending directions. The figure rose to 48% in 2018.
The top 3 cloud providers plus Meta (FB) and Apple were 81% of annualized capex in 1Q23, from 78% in 1Q22 and 71% back in 1Q19. The big story is Meta, though: its metaverse-driven spending spree pushed it to 16.4% of annualized capex in 1Q23, from 10.5% in 1Q22. Amazon remains #1, though: 31.4% of annualized capex in 1Q23, down from 2022 but far ahead of previous years. Across top webscalers, capex is targeting data centers, supporting cloud services and new network functions, with a broad focus on AI tying many investments together.
R&D spend was $280B for the 12 months ended March 2023, up 22% YoY. R&D spend as a percentage of revenues is now 12.5%, up from 10.5% in 1Q22 and easily the highest figure in a decade. Meta (Facebook) is the biggest R&D spender at over 31% of revenues; it has extended its lead with its metaverse push. Baidu is a strong second, focused on AI and autonomous vehicles. Amazon is #3. AI, including new generative platforms like ChatGPT and Bard, will likely drive webscale R&D spending over the next few years.
Profitability is looking up again after a long slide
Revenue declines, combined with high levels of spending, have hit the webscale sector’s margins in recent quarters. Average net income and FCF margins declined steadily from 1H21 through 4Q22; 1Q23 saw a modest turnaround for the better, for both metrics.
Focusing on free cash flow margins is easiest, as they are not impacted by unusual one-time events. In 1Q23, annualized FCF margin was 14.6%, up from 13.6% in 4Q22. This remains low, as average free cash flow margins were ~18-20% for most of the last decade. However, 2021 saw a big drop, and that continued into 2022. Due to ongoing capex outlays amidst slowing revenue growth, free cash flow margin fell to 14% in 2022, from 16% the year before; a capex decline in 1Q23 (v. 1Q22) helped to boost FCF margins slightly. By company, Tencent and Microsoft are far ahead of the “top 8” pack on an annualized net margin basis, at 33% each, and also tied for first with the highest FCF margin (28%). On a profitability per employee basis, Apple still outshines the rest: its annualized FCF per employee was $576K for the 2Q22-1Q23 period, comfortably ahead of #2 Alphabet ($325K). Apple’s dominance has been boosted in the last three years by Huawei’s decline in the high-end device market.
Layoffs hitting headcount
Headcount declined 1% in 1Q23 on a YoY basis, to 4.104 million employees. This is the first YoY drop in webscale employment since our coverage of the sector began in 2011. Amazon was the biggest contributor to the decline, as its headcount dropped by 157K in 1Q23 versus 1Q22. Alibaba and Tencent also saw sizable YoY declines, of 19.7K and 10.K respectively. The biggest growth in headcount in 1Q23 was observed at JD.Com (+66.1K YoY) and Microsoft (+33.2K YoY). Meta’s layoffs have made the most news in the last few quarters, but its headcount in 1Q23 of 77.1K was down only 1% YoY; its sequential 11% decline was more significant. To put these cutbacks in context, though, it’s worth recalling that the webscale sector grew headcount dramatically between 2019 and 2021, from 2.8 million to 4.1 million.
Note that Amazon is by far the largest employer in the webscale sector, accounting for 36% of total employees in 1Q23. Chinese webscalers in aggregate account for about 20% of industry headcount, about the same as the last ten quarters but much more than the 12% figure recorded 7 years ago in 1Q16. JD.Com is the largest single Chinese webscaler by headcount, with ~456K employees as of 1Q23.
These layoffs were probably predictable, given the runup in headcount since COVID and recent market weakness. One metric we track in the webscale sector is free cash flow per employee. From 1Q11 through 3Q21 – more than a decade – this metric hovered in the $90-110K of free cash flow per employee range. Since then, profits failed to keep up with rapid hiring. The metric fell to $89.7K in 4Q21 and further south to $73.9K in 4Q22. In 1Q23, the FCF/employee metric moved in the other direction, up to $79.3K. If this continues to improve, webscale layoffs are likely to ease. If profits fail to recover in 2023, then we will see deeper cuts to the workforce.
Spending outlook
MTN Consulting’s latest operator spending forecast called for $211B in 2023 capex, and $222B in both 2024 and 2025. For now, we will stick with this projection. Our forecast already accounted for a weaker spending climate.
Here is a summary of the spending outlook for key webscalers:
Amazon (31.4% of total webscale capex, annualized): For CY2023, total “capital investments” (CapEx plus equipment finance leases) expected to be lower than the $59B level of 2022, mainly because of declining fulfillment capex. “We’re continuing to invest in infrastructure to support AWS customer needs, including investments to support large language models and generative AI.”
Meta (FB) (16.4%): Expects CY2023 capex of $30-$33B, unchanged from 4Q22 outlook. The outlook “reflects our ongoing build-out of AI capacity to support ads, Feed and Reels, along with an increased investment in capacity for our generative AI initiatives.” CEO noted that company is “no longer behind in building out our AI infrastructure, and to the contrary, we now have the capacity to do leading work in this space at scale,” suggesting that cutbacks in future quarters may occur, depending on financial results.
Alphabet (13.9%): Expects 2023 capex to be “modestly higher than in 2022…We expect the pace of investment in both data center construction and servers to step up in the second quarter and continue to increase throughout the year…AI is a key component. It underlies everything that we do. And we’re continuing to invest in support of AI, support of our users, advertisers and our Cloud customers.” Company says increased capex is due mainly to technical infrastructure investment, while office-related capex will decline.
Microsoft (13.0%): In 1Q23, capex plus finance leases totaled to $7.8B, driven by cloud demand. Outlook for 2Q23 is “a material sequential increase on a dollar basis, driven by investments in Azure AI infrastructure.”
Oracle (4.1%): CapEx in 1Q23 was $2.6 billion as company continues to “build capacity for existing bookings and our customers’ growing needs.” Company expects CapEx to “be about where it is right now for the foreseeable future. As always, we remain careful to pace our investments appropriately and in line with booking trends.”
Alibaba (2.5%): Company in the midst of spinning out its Cloud Intelligence Group as an independent, publicly listed company. No capex guidance. Post spinout capex is likely to grow, lifted by new financing, but that will take a few quarters. Company says, “In cloud computing, progress in industrial digitization and the emergence of AI have created a higher demand for computing power…Alibaba Cloud will focus on seizing these historical opportunities to maximize its market potential.”
Baidu (0.6%): While it’s a small part of the webscale market, Baidu continues to make noise about AI and its new “ERNIE Bot” generative AI platform. Company notes, “our Baidu AI Cloud has reached profitability on the operating level…we aim to continue enhancing the margins across all of our major operations, while at the same time, we also will continue to invest in the promising new areas, in particularly the ERNIE Bot and Intelligent Driving.”
Webscale partnerships with carrier-neutral providers
Webscalers with cloud operations are building out their data center footprints, and most webscalers are deploying more complex functionality into their networks (video, gaming, AI, metaverse). However, webscalers do have some financial pressures, and more important have an increasingly rich range of options for how they expand. The carrier-neutral segment (CNNO) of data center players is investing heavily in larger, more hyperscale-friendly and energy efficient facilities. Further, the sector is consolidating with help from private equity. MTN Consulting expects webscalers to continue to lean heavily on these third-parties for expansion in 2023 and beyond. As a result, data center CNNOs like Digital Realty, Equinix and its JV partners, QTS/Blackstone, CyrusOne/KKR/GIP, American Tower/CoreSite, and GDS will become more attractive to vendors as they invest more in network technology of their own.
- Table Of Contents
- Figures & Charts
- Coverage
- Visuals
Table Of Contents
- Abstract
- Analysis
- WNO Market: Key Stats
- Company Drilldown
- Top 8 WNOs
- Company Benchmarking
- Regional Breakouts
- Raw Data
- Exchange Rates
- About
Figures & Charts
- Key Metrics: Growth rates, Annualized 1Q23/1Q23 vs. 2011-22
- WNO Revenues: Single-quarter & annualized (US$M)
- Top 8 WNOs: YoY revenue growth in 4Q22
- Annualized profitability: WNOs
- Free cash flow per employee, 1Q23 annualized (US$)
- FCF Margins vs. Net Margins, 1Q23 annualized
- Advertising revenues as % total (FY2022)
- Annualized capex and R&D spending: WNOs (% revenues)
- WNO capex by type, Annualized: 1Q15-1Q23 (US$M)
- Network & IT capex as share of revenues, 1Q23 annualized
- R&D expenses as % revenues, Top 8 WNOs (1Q23 annualized)
- Acquisition spending vs. capex spending, annualized (US$M)
- Net PP&E per employee (US$’ 000) – 1Q23
- Ranking the Webscale Network Operators: Revenues; R&D; Capex; Network & IT capex – 2022 & 1Q23 (US$B)
- Annualized spending share for key webscalers since 2011 Capex: Network, IT and software
- Share of webscale spending by company, 1Q23 and 1Q22 annualized (Capex: Network, IT and software)
- Electricity consumption vs. Net PP&E for key webscalers in 2021
- Webscale vs. Telco Market: Annualized Capex (US$B)
- Webscale vs. Telco Market: Annualized capital intensity
- Revenues: annual, single-quarter, and annualized (US$M)
- Profitability (Net Profit; Cash from operations; Free cash flow): annual, single-quarter, and annualized (US$M)
- Spending (R&D; M&A; Capex; Network & IT capex; Lease): annual, single-quarter, and annualized (US$M)
- Cash & Short-term Investments: annual and single-quarter (US$M)
- Debt (Total debt; Net debt): annual and single-quarter (US$M)
- Property, Plant & Equipment: annual and single-quarter (US$M)
- Key Ratios: Net margin; R&D/revenues; Capex/revenues; Network & IT capex/revenues; Free cash flow/revenues; Lease costs/revenues – annual and annualized (%)
- Total employees
- Revenue per employee, annualized (US$K)
- FCF per employee, annualized (US$K)
- Net PP&E per employee, annualized (US$K)
- Revenues & Spending (US$M)
- Webscale Business Mix by Revenues (FY2022) – MTN Consulting estimates
- Top 10 recent acquisitions & investments
- Data center footprint
- Revenues (US$M) & YoY revenue growth (%), single-quarter: by company
- Revenues, annualized (US$M): by company
- Annualized profitability margins: by company
- Annualized capex and capital intensity: by company
- Annualized capex and R&D spending as % of revenues: by company
- Share of WNO network & IT capex, Annualized: by company
- Total employees: by company
- Annualized per-employee metrics (US$000s): by company
- Net debt (debt minus cash & stock) (US$M): by company
- 2011 vs. 2022: company benchmark by KPI (Revenues, R&D, Net profit, Cash from operations, Capex, Free cash flow, Cash & short-term investments, Net PP&E, Total debt)
- 2011 vs. 2022: company benchmark by key ratio (Capex/revenues; R&D/revenues; Net margin; FCF margin)
- Top 8 WNO’s share vs. Rest of the market: by KPI (Revenues, R&D, Net profit, Cash from operations, Capex, Free cash flow, Cash & short-term investments, Net PP&E, Total debt)
- Top 8 WNOs benchmarking by Key ratio: Capex/revenues; R&D/revenues; Net margin; FCF margin)
- Total WNO Market Revenues, by region: Latest CY; Latest Quarter; Annual trend (2011-22); Single quarter (1Q15-1Q23)
- WNO Market: Revenues, single-quarter (YoY % change)
- Regional revenues by operator: Latest CY; Latest Quarter; Annual trend (2011-22); Single quarter (1Q15-1Q23)
- Top 10 operators by region: Latest CY; Latest Quarter
Coverage
| Top 8 WNOs | |||
| Alibaba | Alphabet | Amazon | Apple |
| Baidu | Meta (FB) | Microsoft | Tencent |
| Other WNOs | |||
| Altaba | ChinaCache | Cognizant | eBay |
| Fujitsu | HPE | IBM | JD.com |
| Oracle | SAP | ||
| Yandex | |||
Visuals