By Matt Walker
This forecast spreadsheet details MTN Consulting’s forecast for revenues, capex, headcount, and other metrics across three segments of network operators: telecom operators (telcos), webscale network operators (webscalers), and carrier-neutral operators (CNNOs). The spreadsheet provides 2011-21 actuals and projections through 2027, and includes projections from past forecasts for reference.
Top line quantitative results
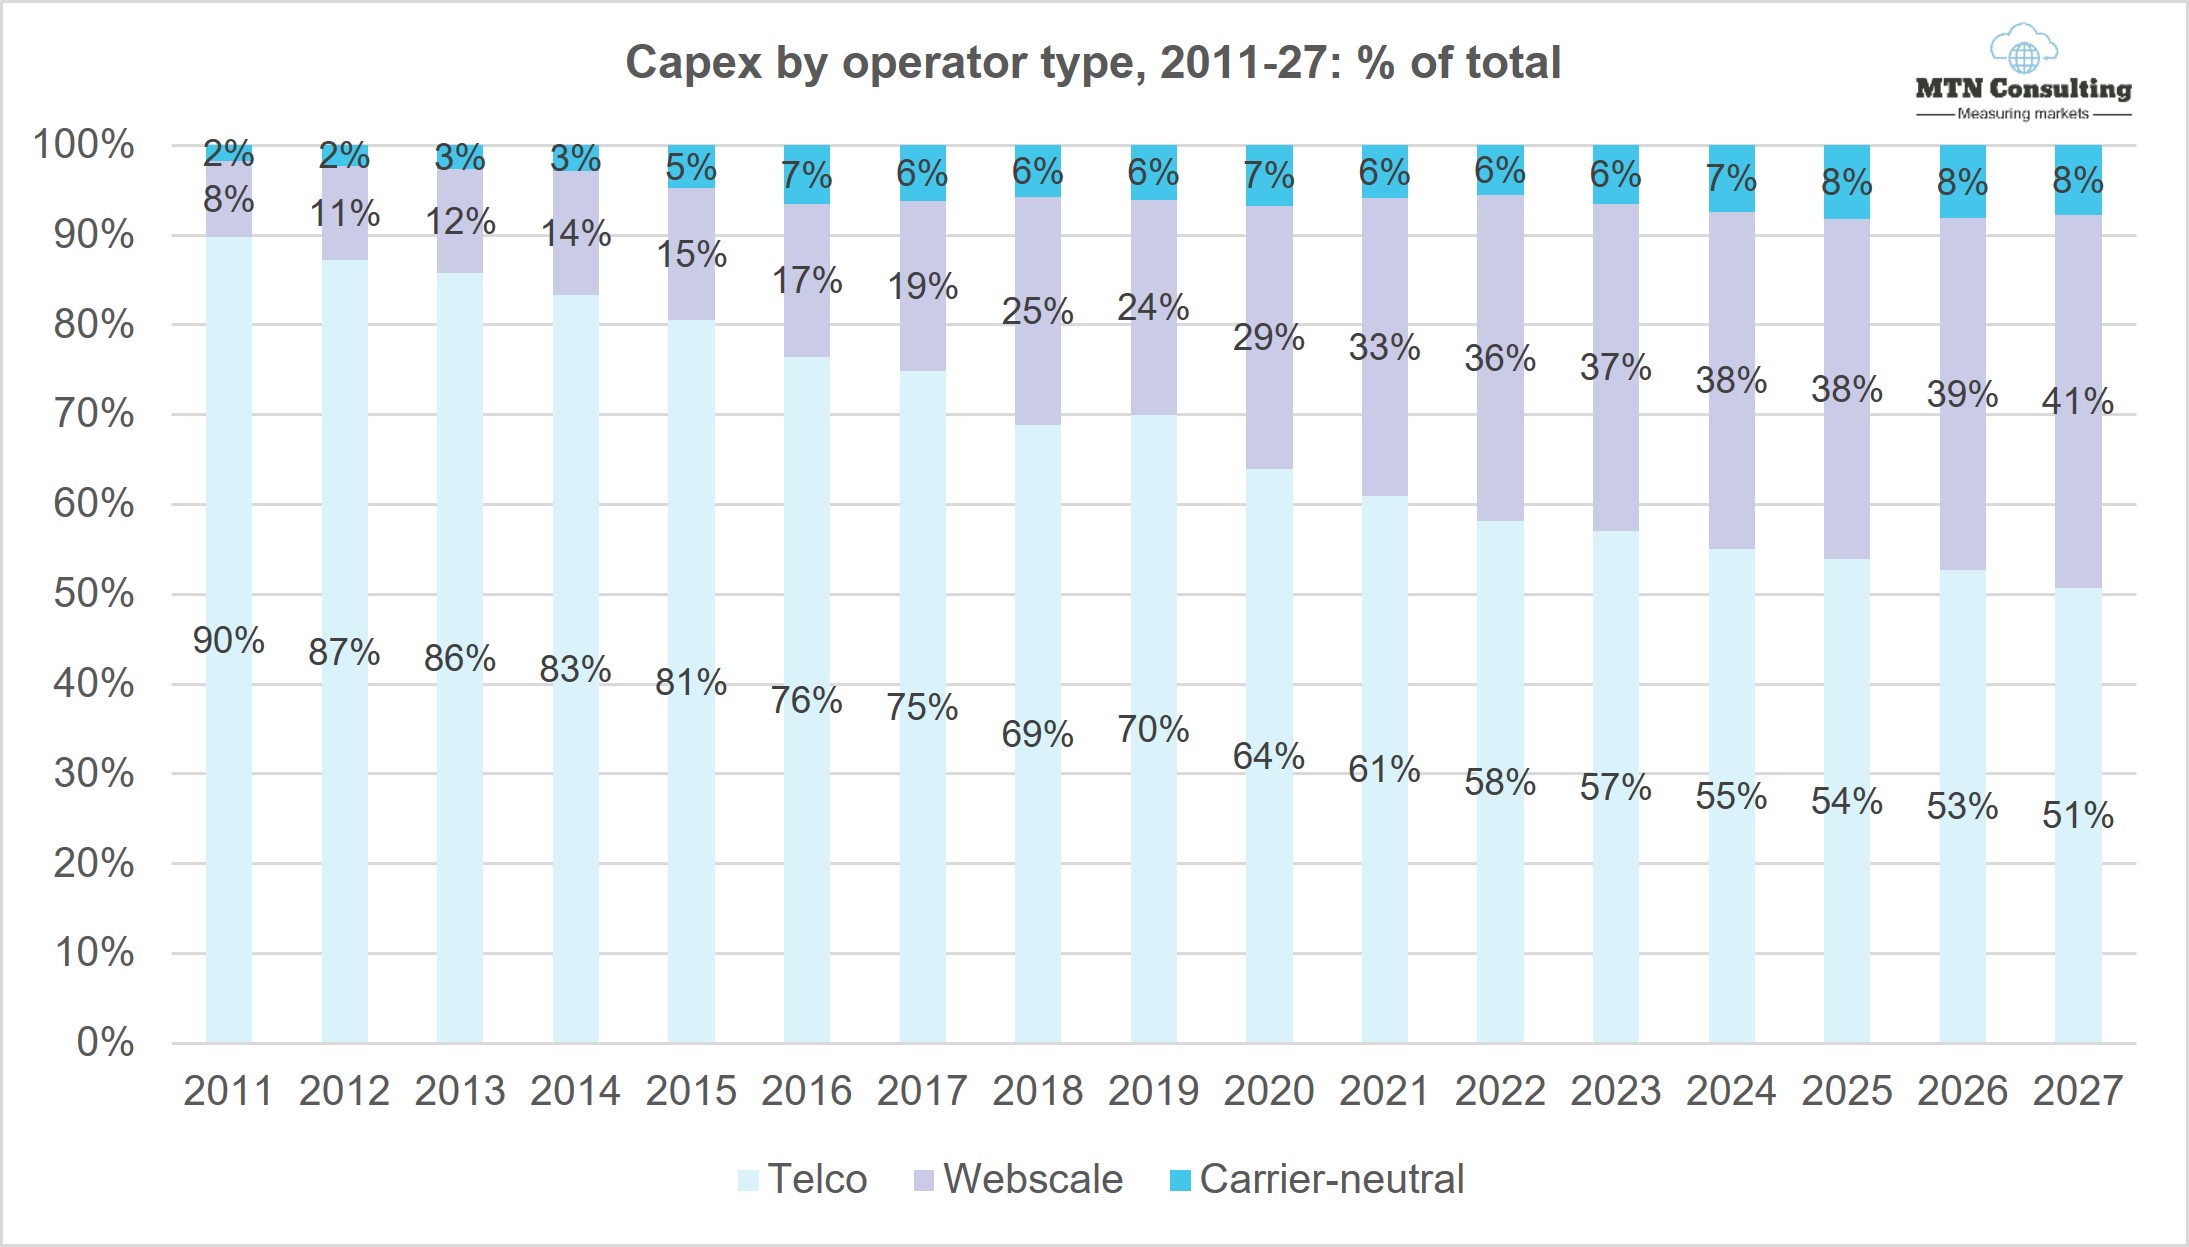
Revenues from the aggregate of our three segments – telco, webscale, and carrier-neutral – were $4,121 billion (B) in 2021, and will grow to $5,755B by 2027. Three segment capex ended 2021 at $536B, and will likely hit $646B in 2027. Most of the growth is from webscale. In 2011, webscale was less than 10% of capex, but had grown to 33.2% in 2021 and will progress upwards to over 41% by 2027. Telco capital intensity peaks in 2022 at 18% in 2022 and heads towards a bit more than 16% by 2027. Webscale capital intensity averages around 8% for the forecast period, with a big piece of the near-term upside coming from Meta/Facebook. Capital intensity is highest in carrier-neutral, as usual, well over 30% for the whole forecast period.
Headcount across the three operator segments has grown dramatically in the last decade, from 6.48 million in 2011 to 8.86M in 2021; it’s likely to hit 10.2 million by 2027. Nearly all of the growth is from webscale, with a good portion of this growth on webscale’s ecommerce side (e.g. Amazon, Alibaba, and JD.COM). Revenue per employee is highest in carrier-neutral, and will see the fastest growth during the forecast as data center-focused CNNO companies account for more growth. Telcos, though, will also grow revenue per employee from about $405K in 2021 to $492K as they learn how to do more with less, implementing automation across their operations.
Macro trends shaping forecast
This forecast was last updated in mid-June 2022. Since then, COVID-19 worries have continued to subside. Vaccination rates are high in most countries, newer strains are less severe, and death and serious illness are less common. COVID-19 clearly left a lasting impact on the globe, in terms of the loss of life, most important, as well as (hopefully) a wider understanding of the risks of viral outbreaks. It’s not clear yet whether societies are any more willing to invest up front to prevent the outbreaks.
COVID-19 also accelerated trends already underway, giving a boost to virtual work and school, and encouraged enterprises to speed up their digital transformation efforts. That gave cloud providers – including the key players tracked in our webscale segment – the confidence to speed up their network investments. Webscale profits soared during the pandemic. Telcos did not see this same jump. Many did accelerate their cost cutting efforts, closing down retail shops and embarking on layoffs. Telco margins ticked up only slightly in 2021, though. Meanwhile, the telco industry has jumped into rapid deployment of 5G networks in most of the world. Despite vendors’ promise that this upgrade would be mostly about software, and involve less capex than before, telco capital intensity has approached 18% over the last two quarters. That’s even higher than the LTE buildout’s peak.
The context for this is war in Europe, high inflation rates worldwide, and high interest rates
Putin’s war on Ukraine drags on, causing death and destruction and worsening the inflationary environment. Energy prices are especially impacted; the US CPI for energy increased 13.1% for the year ended November 2022. Energy costs are significant for network operators, putting pressure on costs and hence margins. As inflation has spread in 2022, governments have responded with higher interest rates. The fed funds rate in the US is now 4.5%, the highest level since late 2007, and additional increases are likely (Dec. 14: “The Committee anticipates that ongoing increases in the target range will be appropriate …”). While these rates are well below pre-2000 averages, increased interest rates do make it harder for operators to fund investment projects, and make it tougher for their customers to pay the bills.
The supply side is also in flux. Key operators continue to cite shortages of key components and chips needed to build out their networks, and in some cases labor shortages impacting the pace of network deployment. Shortages mean delays, and often higher costs for a given product or service. Huawei is also relevant. Huawei continues to be locked out of many overseas markets, more so than a year ago. That creates opportunities for other vendors in the “Huawei displacement” area, but also likely increases the costs of some projects.
Finally, while COVID is not a primary factor in business nowadays, it has impacted China in a big way in 2022. The government’s zero COVID policy has complicated life for residents, caused shutdowns, and slowed down manufacturing. That worsens the supply chain issue in the short term, and in the longer term will further entice operators and vendors to seek out alternate sources of supply.
Network operator interdependence
The three groups of operators we track pursue a range of different business models, even within segments. Webscale revenue models revolve around a diverse mix of advertising, devices, software, cloud services, and ecommerce. Carrier-neutral providers, to simplify, rent network infrastructure to other businesses. Telcos sell subscription and pay-as-you-go services for communications services, including bandwidth, video, mobility, and enterprise services. There is a huge amount of variety in these discrete market segments. What’s more important, though, is that the three segments rely on each other in important ways. Carrier-neutral players get most of their revenues from telcos & webscalers needing to fill gaps in network coverage and accelerate time to market. Telcos rely on CNNOs to lower their cost of operations, and need webscalers to provide services and apps which make their network worth using beyond telephony. Webscalers lack last mile access networks and can only deliver their services to the mass market over telco infrastructure. Webscalers also, despite big capex outlays, can only blanket the globe with data centers by partnering with CNNOs for collocation.
This interdependence will grow. The big cloud providers in the webscale market, for instance, have targeted the telecom vertical and found success; AWS, Azure and GCP combined for about $4.0B in revenues from telcos for the latest annualized period (4Q21-3Q22), up 77% YoY. Telcos are making some big bets on cloud technology as they deploy 5G core networks. Both telcos and webscalers want to provide seamless, resilient network coverage, including at the edge, and can’t build it all themselves. As a result, they’ll need to scale up their partnerships with carrier-neutral players like Equinix and American Tower/CoreSite. CNNOs are increasingly taking over the “dumb pipe” aspects of the network, and to be competitive and upsell they will integrate assets across fiber, cell tower and data center.
Key findings by network operator type
This report includes detailed breakouts for each of the three network operator types. Here is a summary of some of the key findings, by segment:
Telcos: revenues for the telco segment will continue to just barely grow in the 2022-27 forecast period. The occasional network upgrade resulting in surges in device revenues complicate this story, but underlying service revenue growth remains tiny or negative in many big markets. In 2027, revenues will be a bit more than $2 trillion, from $1,891B in 2021. Capex in the telco sector has surged recently with costly 5G upgrades, and a surprising number of fiber buildouts, concentrated in the US and Europe. That will push capex up to about $330B in both 2022 and 2023, from an average of $307B for the prior 10 years. Capital intensity is currently at an all-time high, likely to end 2022 at 18%, but will drop to the 16-17% range by 2024. There is a lot of variation around this average; for instance, the US figure for 2027 is 13%, versus 22% for Indonesia. The telco sector will continue to see steady reductions in headcount, falling an average of 2% per year from 2021 to 2027, ending the period at about 4.1 million. The average employee will get costlier, though, due to labor market competition and the need for more expensive skills: labor cost per employee will likely hit $69.2K per year in 2027, from $57.8K in 2021. Software capex will continue to grow as a percent of total capex.
Webscalers: this market has driven overall network operator growth over the last few years. In 2022 the sector had a bit of a reality check, as economic turmoil slowed ad spending, an easing of the pandemic caused some online activities to slow, and the Chinese government tightened regulations on local providers. Revenues in 2022 are likely to grow just 8%, to $2,315B, a letdown after the 25% growth recorded in 2021. The sector has deep pockets though, and the cloud providers in webscale remain committed to blanketing the world with their data centers. Capex will grow from $178B in 2021 and $206B in 2022, to roughly $268B in 2027. A larger portion of total capex will be for network/IT assets, as webscalers complete much of their physical footprints and lease more of their overall data center footprints from third parties. Heavy R&D investments will remain central to how webscalers grow the top line and develop new markets: R&D/revenues will remain over 10% for the global market ex-China through 2027. Chinese webscaler spend on R&D will be in the range of 6-7% of revenues.
CNNOs: the small sector of carrier-neutral network operators will continue to support efficient growth, time to market, geographic scope, and margins for the telco and webscale sector. It remains small, though. In 2021, CNNO revenues were $91.5B, which will grow to about $147B by 2027. Capital intensity is well above 30% in this segment. By 2027, CNNO capex will reach about $50B, from $31B in 2021. More of CNNO capex will target technology going forward as many key CNNOs already own much of the physical assets (e.g. towers, land for data center construction) that they need. As such vendors will see more opportunities in the market. Physical footprint: by 2017, CNNOs will operate about 3.53 million cell towers (2021: 3.08M), 1,656 data centers (2021: 1,168), and 1.1 million route miles of fiber. Tower tenancy ratios will grow, as will the average size of a CNNO data center, in net rentable square footage.
Contrasting this current forecast with the forecast published in December 2021, the biggest numeric changes include: weaker revenue growth outlook in telecom; slightly faster headcount reduction in telecom; lower labor cost spending for telcos due to a methodology change affecting the US market; a slightly higher capex forecast for webscale, concentrated on the network/IT side; higher R&D spend for webscale; weaker headcount growth in webscale; and, a less optimistic growth outlook for CNNO.
- Table Of Contents
- Figures & Charts
- Coverage
- Visuals
Table Of Contents
Key sections include:
- Abstract
- Total Network Operator Market Projections
- TNO Projections
- TNO Regional Split Projections
- WNO Projections
- CNNO Projections
- Top spenders – spending outlook
- About
Figures & Charts
- Revenue by operator type, 2011-27 (US$B)
- Capex by operator type, 2011-27 (US$B)
- Capex by operator type, 2011-27: % of total
- Capital intensity by operator type, 2011-27
- Employees by operator type (M)
- Revenues/employee by operator type (US$K)
- Capex forecast by segment: Dec 2022 v. Dec. 2021 outlook, % difference
- Capex forecast by segment: Dec 2022 v. Dec. 2021 outlook, $B difference
- Top 50 spending operators, annualized 3Q22 capex ($B)
- Telcos: Revenues ($B) vs. capital intensity
- Software capex in US$B and as % of total capex
- Telco opex components: 2017, 2022 and 2027
- Telcos: Capex and network operations opex ($B)
- Telcos: Employees vs. average labor cost per employee ($K)
- Telcos: Labor cost opex in US$B and as % of Opex ex-D&A
- Telco margins, actual and forecast
- Dec 2022 vs. Dec 2021 forecast: % changes in key metrics
- Revenues by region: 2017, 2021, and 2027 (US$B)
- Telco capex by region, select years (US$B)
- Telcos: capital intensity by region
- Capex by region, % global
- Capex by region: Dec 2022 vs. Dec 2021 Forecast
- Telco capital intensity for last five forecasts
- Webscale revenues and capital intensity
- Webscale capital intensity by company HQ
- Webscale capex by company HQ (US$B)
- Webscale capex by type (US$B)
- Webscale R&D as % of revenues by company HQ
- Webscale revenue per employee ($K) by company HQ
- Percent change in outlook, Dec 2022 vs. Dec 2021 forecast
- Webscale capex by type: % change in forecast, 12/22 vs 12/21
- Carrier-neutral operators: Revenues and capital intensity
- CNNO employees and revenues per employee
- CNNO Towers and Tenancy Ratio, global ex-China
- Number of data centers and average net rentable floorspace (in square feet) per data center
- % difference in key metrics: Dec 2022 vs. Dec 2021 forecast
- CNNO capex by forecast vintage ($B)
- Capital intensity: 2011-21 by segment and 2022-27 average
- CNNO capex by segment, 2011-21 (US$B)
Coverage
Companies mentioned:
21Vianet
A1 Telekom Austria
Advanced Info Service (AIS)
Airtel
Alibaba
Alphabet
Altice Europe
Altice USA
Amazon
America Movil
American Tower
Apple
AT&T
Axiata
Axtel
Baidu
Balitower
Batelco
BCE
Bezeq Israel
Bharti Infratel
Bouygues Telecom
BSNL
BT
Cable ONE, Inc.
Cell C
Cellcom Israel
Cellnex
CenturyLink
Charter Comms
China Broadcasting
China Mobile
China Telecom
China Tower
China Unicom
ChinaCache
ChinData
Chorus Limited
Chunghwa Telecom
Cincinatti Bell
CK Hutchison
Cogeco
Cogent
Cognizant
Comcast
Consolidated Communications
CoreSite Realty
Crown Castle
Cyfrowy Polsat
CyrusOne
Cyxtera
DEN Networks Limited
Digi Communications
Digital Realty
Dish Network
Dish TV India Limited
DT
Du
eBay
EI Towers
Elisa
Entel
Equinix
Etisalat
Facebook
Far EasTone Telecommunications Co., Ltd.
Frontier Communications
Fujitsu
GDS Data Centers
Globe Telecom
Grupo Clarin
Grupo Televisa
GTL Infrastructure
GTT Communications
Hathway Cable & Datacom Limited
HPE
IBM
IHS Towers
Iliad SA
Internap
Inti Bangun Sejahtera
Inwit
JD.COM
KDDI
Keppel DC REIT
KPN
KT
Level 3
LG Uplus
Liberty Global
M1
Maroc Telecom
Maxis Berhad
Megafon
Microsoft
Millicom
Mobile Telesystems
MTN Group
MTNL
NBN Australia
NEXTDC
NTT
Oi
Omantel
Ooredoo
Oracle
Orange
PCCW
PLDT
Proximus
QTS Realty
Quebecor Telecommunications
Rakuten
Reliance Communications Limited
Reliance Jio
Rogers
Rostelecom
Safaricom Limited
SAP
Sarana Menara Nusantara
Sasktel
SBA Communications
Shaw
Singtel
SITI Networks Limited
SK Telecom
SmarTone
SoftBank
Solusi Tunas Pratama
Spark New Zealand Limited
StarHub
STC (Saudi Telecom)
Summit Digitel
Sunevision
Superloop
Swisscom
Switch
Taiwan Mobile
Tata Communications
Tata Teleservices
TDC
TDF Infrastructure/Arcus
TDS
Tele2 AB
Telecom Argentina
Telecom Egypt
Telecom Italia
Telefonica
Telekom Malaysia Berhad
Telenor
Telesites
Telia
Telkom Indonesia
Telkom SA
Telstra
Telus
Tencent
Thaicom
Tower Bersama Infrastructure
TPG Telecom Limited
True Corp
Turk Telekom
Turkcell
Twitter
Uniti Group
Veon
Verizon
Vodafone
Vodafone Idea Limited
VodafoneZiggo
Windstream
Yandex
Zain
Zain KSA
Zayo
Visuals