By Matt Walker
This report reviews the growth and development of the webscale network operator (WNO) market. On an annualized (12 month) basis through 3Q22, webscalers represent $2.23 trillion (T) in revenues (+8% YoY), $255 billion (B) in R&D spending (+23% YoY), and $199B in capex (+19% YoY), and had $613B of cash and short-term investments (-19% YoY) on the books as of September 2022. Webscalers employed approximately 4.095M people in September 2022, from 4.047M in June 2022 and 3.941M in September 2021.
Revenue growth slowing for most key webscalers
The webscale sector has fallen back to earth recently. Annualized revenue growth has now fallen below its long-term average. Supply chain constraints, inflation, and a war in Europe all hit growth, as does a weak economy and tight online regulations in China. Globally, annualized YoY revenue growth in 3Q22 was just 8%, the lowest result since 4Q16 (7.2%). Regionally, growth in the Americas has been steady, with revenues up 13%, 9%, and 12% YoY in the last three quarters, but the other three regions have dragged down the average. In 3Q22, revenues grew 2% YoY in MEA, and just 1% YoY for both Europe and AP.
Topline growth in single quarter revenues has been in the single digits for all of 2022, recording just under 6% growth YoY in 3Q22. In general revenue growth rates have been weakening across the board, but Amazon and Apple were exceptions in 3Q22, growing by 15% and 8% respectively, much improved from 2Q22. It’s notable that neither of these companies is heavily dependent on advertising. Microsoft also had a good quarter of growth in 3Q22, and like Amazon and Apple is not reliant on ad revenues.
Among decliners: Facebook faces tougher competition from other platforms (e.g. TikTok), while Alibaba, Tencent and Baidu were all hit by a weaker Chinese economy, lockdowns, and tighter regulations around gaming and online activities.
Technology spending continues to surge, despite slower revenue growth
Capex and R&D spend are both at all-time highs as a % of revenues. Capex has been rising gradually since 2019; R&D has grown more recently, due in part to Facebook.
In $ terms, annualized capex has increased dramatically, reaching $199B in 3Q22, from $124B in 3Q20. The tech (network/IT/software) portion of capex is in the low 40s %-wise, down from nearly 50% in late 2018/early 2019. Webscalers have been investing more in land/property and new data centers recently; tech’s portion will rise in coming quarters.
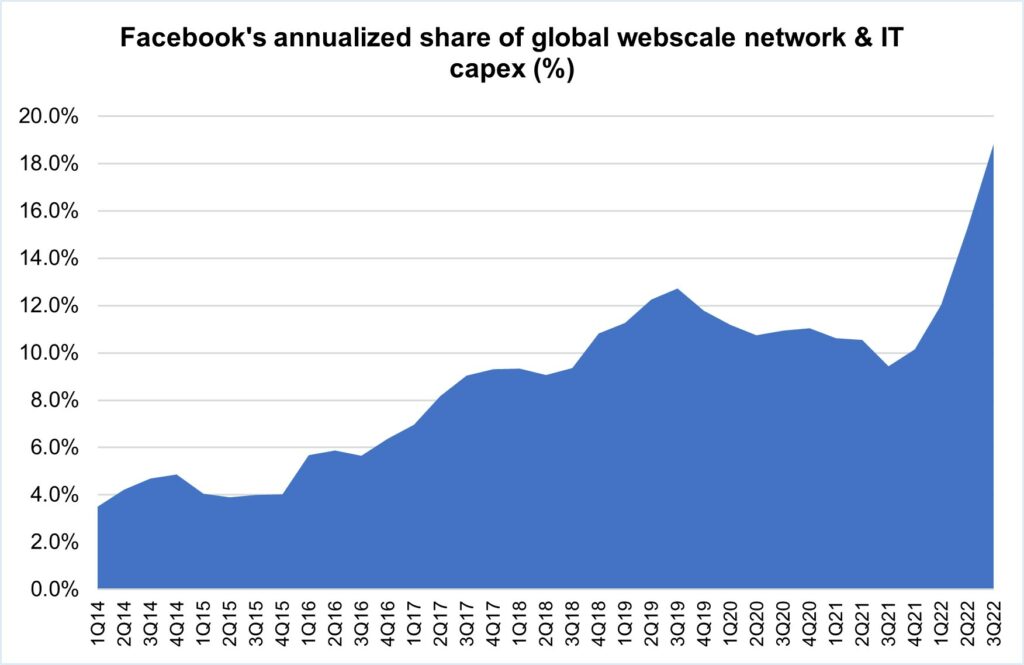
The top 3 cloud providers plus Facebook were 75% of 4Q21-3Q22 capex, a bit higher than the 72% recorded in the 3Q21 annualized period. That’s because of Facebook’s metaverse-driven spending spree. Still, Amazon is the spending standout, accounting for 33% of total annualized capex in 3Q22 (3Q21: 34%). Across the top webscalers, capex has surged due to new data centers, supporting cloud services and new network functions. Smaller webscalers struggle to keep up, now relying more on third party data centers and migrating to capex-light strategies. That’s especially true for IT services focused companies like Cognizant, Fujitsu, HPE, IBM, and SAP.
Regionally, the Americas account for the majority of the global market, with the US at the center. For instance, both Alphabet and Facebook (Meta) say well over 70% of their “long-lived assets” are in the US. Going forward, the non-US portion should rise as the cloud providers within the webscale market build out their global data center footprints. Consider Google Cloud, for instance. It is currently expanding into the following regions: Doha (Qatar), Turin (Italy), Berlin (Germany), Dammam (Kingdom of Saudi Arabia), Mexico, Malaysia, Thailand and New Zealand. In 2022, Google launched GCP regions in Tel Aviv, Israel (October); Milan, Italy; Madrid, Spain; Columbus, Ohio; and Dallas, Texas. It also launched a third data center in Singapore, in August 2022.
Annualized webscale capex is now nearly 60% as much as telecom sector capex. Webscalers’ R&D spend is more significant. While telcos spend at most 1-2% of revenues on R&D, webscalers’ R&D spend for the 3Q22 annualized period amounted to 11.4% of revenues. Large portions of this R&D are network-related, as the biggest webscalers have bleeding-edge requirements for the technology they deploy in their network. That has led them to drive the creation of many new innovations in network infrastructure over the last few years. These span semiconductors, optical transmission and components, intent-based routing, network automation, and other areas.
Free cash flow and net margins dropping but cash reserves remain relatively healthy
Recent declines in revenue growth, combined with continued high levels of spending, have hit the webscale sector’s overall average margins in recent quarters. Average margins have been declining for several quarters.
Webscalers’ average free cash flow margins hovered around 18-20% for most of the last decade; 2021 saw a big drop, and that has continued into 2022. In 2021, several companies, led by Amazon and Facebook, decided to invest heavily in network and overall business expansion. This came as COVID-19 started to ease and it became clear that one, the economy would recover, and two, webscale business models were direct beneficiaries of the changes wrought by the pandemic. Webscalers used some of their carefully saved cash hordes to invest heavily in their networks. Due to ongoing capex outlays amidst slowing revenue growth, free cash flow margin fell to 14% in the 3Q22 annualized period.
Net margins can swing due to one-off factors, such as asset sales, court judgements or tax hits. That was the case back in 4Q17, for instance, when Alphabet, eBay, IBM, and Microsoft all booked one-time hits. After this anomaly, net margins returned to their historic average around 16-18%, and rose above 20% in 2021 as post-COVID growth surged. In the last three quarters, though, annualized net margins dropped markedly. One cause was Amazon, which took a $7.6B writeoff on the valuation of its stake in Rivian Automotive, in 1Q22. In 3Q22, both Alibaba and IBM recorded sizable net losses, due to writedowns in the value of equity investments at Alibaba, and a one-time non-cash pension settlement charge at IBM.
The webscale sector’s key players occasionally come under fire for retaining vast hordes of cash on their books. The response is usually to emphasize the need to save for a rainy day, or when there is a need to spend big in order to forestall a new competitor entering the market. The last year has seen both ‘rain’ and new competition. As a result, the sector’s overall cash position has weakened. In 3Q22, webscalers had about $613B of cash & equivalents on the books, down from $754B in 3Q21. Debt rose in the same period, from $532B in 3Q21 to $548B in 3Q22. The sector still has more cash than debt, i.e. its net debt is negative, but the gap is shrinking. Net debt was just -$65B in 3Q22, from -$222B a year earlier.
Network investment outlook
Our current forecast calls for $188B of webscale capex in 2022, and further growth in the out-years until capex hits about $276B in 2026. The 2022 target has already been exceeded, based on the 3Q22 annualized figure. While 2022 spending will exceed the forecast target, there is a good chance that 2023 and 2024 will see some moderation relative to the current forecast. We will formally update our forecast in the next few weeks.
Capex guidance from the major webscalers on recent analyst calls is as follows:
- Amazon: notes that it has cut its 2022 capex budget slightly but still sees a “$10 billion year-over-year increase in technology infrastructure, primarily to support the rapid growth, innovation and continued expansion of our AWS footprint”. Beyond 2022, suggests that capex “tied to data centers and the AWS ramp can ultimately step back.”
- Alphabet: no new guidance, other than that 2022 capex will be bigger than 2021. Does not commit to pulling back capex in 2023 despite prompt from analysts on earnings call. Simply notes that “the technical infrastructure team has consistently focused on levers to improve utilization and efficiency and they continue to do so.”
- Microsoft: “Our data center investments continue to be based on strong customer demand and usage signals…[for 4Q22] we expect a sequential increase on a dollar basis with normal quarterly spend variability in the timing of our cloud infrastructure build-out.”
- Facebook (Meta): despite weak revenue result in 3Q22, is sticking with ambitious spending plans. “We expect 2022 capital expenditures, including principal payments on finance leases, to be in the range of $32 billion to $33 billion updated from our prior range of $30 billion to $34 billion. For 2023, we expect capital expenditures to be in the range of $34 billion to $39 billion driven by our investments in data centers, servers and network infrastructure. An increase in AI capacity is driving substantially all of our capital expenditure growth in 2023.”
- Oracle: still expects capex for FY ended May 2023 to be higher than previous year. However, at October analyst event, suggested that incremental capex will be much more success-based, “building out the hotel room[s]” after spending a lot initially to develop the hotel itself.
- Tencent, Alibaba, Baidu, and JD.Com: have not provided capex guidance recently. Given tough economy, new regulations and weak recent growth, their capex is constrained. In 2023 and beyond, though, Tencent is one to watch, as it has hinted at Facebook-like investments in the “metaverse,” says it has a lot of the building blocks needed, for example, “a lot of gaming experiences…very strong social networking experience…engine capability, we have AI capability, we have the capability to build a large server architecture that can serve a huge number of concurrent users. We are very experienced in managing digital content economies as well as real-life digital assets.”
- Apple: modest outlook, thinks its “capital intensity is really very good” and “there is nothing unusual we see [requiring capex] for the next 12 months”.
Implications for carrier-neutral market segment
Webscalers with cloud operations are building out their data center footprints, and most webscalers are deploying more complex functionality into their networks (video, gaming, AI, metaverse). However, webscalers do have some financial pressures, and more important have an increasingly rich range of options for how they expand. The carrier-neutral segment (CNNO) of data center players is investing heavily in larger, more hyperscale-friendly and energy efficient facilities. Further, the sector is consolidating with help from private equity. MTN Consulting expects webscalers to continue to lean heavily on these third-parties for expansion in 2022 and beyond. As a result, data center CNNOs like Digital Realty, Equinix and its JV partners, QTS/Blackstone, CyrusOne/KKR/GIP, American Tower/CoreSite, and GDS will become more attractive to vendors as they invest more in network technology of their own.
One issue with more reliance on third-parties, though, is sustainability. As a whole, the carrier-neutral sector is behind the curve on investing in renewable energy resources. If webscalers want to make credible boasts about their environmental impact, they will need to present data on their overall usage of renewable energy, not just what’s used by their own data centers. Water consumption is another issue of importance in this area, and even harder to track.
- Table Of Contents
- Figures & Charts
- Coverage
- Visuals
Table Of Contents
- Abstract
- Analysis
- WNO Market: Key Stats
- Company Drilldown
- Top 8 WNOs
- Company Benchmarking
- Regional Breakouts
- Raw Data
- Exchange Rates
- About
Figures & Charts
- Key Metrics: Growth rates, Annualized 3Q22/3Q21 vs. 2011-21
- WNO Revenues: Single-quarter & annualized (US$M)
- Top 8 WNOs: YoY revenue growth in 3Q22
- Annualized profitability: WNOs
- Free cash flow per employee, 3Q22 annualized (US$)
- FCF Margins vs. Net Margins, 3Q22 annualized
- Advertising revenues as % total (FY2021)
- Annualized capex and R&D spending: WNOs (% revenues)
- WNO capex by type, Annualized: 3Q15-3Q22 (US$M)
- Network & IT capex as share of revenues, 3Q22 annualized
- R&D expenses as % revenues, Top 8 WNOs (3Q22 annualized)
- Acquisition spending vs. capex spending, 3Q15-3Q22 annualized (US$M)
- Net PP&E per employee (US$’ 000) – 3Q22
- Ranking the Webscale Network Operators: Revenues; R&D; Capex; Network & IT capex – 2021 & 3Q22 (US$B)
- Annualized spending share for key webscalers since 2011 Capex: Network, IT and software
- Share of webscale spending by company, 3Q22 and 3Q21 annualized (Capex: Network, IT and software)
- Electricity consumption vs. Net PP&E for key webscalers in 2021
- Webscale vs. Telco Market: Annualized Capex (US$B)
- Webscale vs. Telco Market: Annualized capital intensity
- Revenues: annual, single-quarter, and annualized (US$M)
- Profitability (Net Profit; Cash from operations; Free cash flow): annual, single-quarter, and annualized (US$M)
- Spending (R&D; M&A; Capex; Network & IT capex; Lease): annual, single-quarter, and annualized (US$M)
- Cash & Short-term Investments: annual and single-quarter (US$M)
- Debt (Total debt; Net debt): annual and single-quarter (US$M)
- Property, Plant & Equipment: annual and single-quarter (US$M)
- Key Ratios: Net margin; R&D/revenues; Capex/revenues; Network & IT capex/revenues; Free cash flow/revenues; Lease costs/revenues – annual and annualized (%)
- Total employees
- Revenue per employee, annualized (US$K)
- FCF per employee, annualized (US$K)
- Net PP&E per employee, annualized (US$K)
- Revenues & Spending (US$M)
- Webscale Business Mix by Revenues (FY2021) – MTN Consulting estimates
- Top 10 recent acquisitions & investments
- Data center footprint
- Revenues (US$M) & YoY revenue growth (%), single-quarter: by company
- Revenues, annualized (US$M): by company
- Annualized profitability margins: by company
- Annualized capex and capital intensity: by company
- Annualized capex and R&D spending as % of revenues: by company
- Share of WNO network & IT capex, Annualized: by company
- Total employees: by company
- Annualized per-employee metrics (US$000s): by company
- Net debt (debt minus cash & stock) (US$M): by company
- 2011 vs. 2021: company benchmark by KPI (Revenues, R&D, Net profit, Cash from operations, Capex, Free cash flow, Cash & short-term investments, Net PP&E, Total debt)
- 2011 vs. 2021: company benchmark by key ratio (Capex/revenues; R&D/revenues; Net margin; FCF margin)
- Top 8 WNO’s share vs. Rest of the market: by KPI (Revenues, R&D, Net profit, Cash from operations, Capex, Free cash flow, Cash & short-term investments, Net PP&E, Total debt)
- Top 8 WNOs benchmarking by Key ratio: Capex/revenues; R&D/revenues; Net margin; FCF margin)
- Total WNO Market Revenues, by region: Latest CY; Latest Quarter; Annual trend (2011-21); Single quarter (3Q14-3Q22)
- WNO Market: Revenues, single-quarter (YoY % change)
- Regional revenues by operator: Latest CY; Latest Quarter; Annual trend (2011-20); Single quarter (3Q14-3Q22)
- Top 10 operators by region: Latest CY; Latest Quarter
Coverage
| Top 8 WNOs | |||
| Alibaba | Alphabet | Amazon | Apple |
| Baidu | Microsoft | Tencent | |
| Other WNOs | |||
| Altaba | ChinaCache | Cognizant | eBay |
| Fujitsu | HPE | IBM | JD.com |
| Oracle | SAP | ||
| Yandex | |||
Visuals