By Matt Walker
This brief examines energy consumption in the network operator industry, spanning telcos, webscalers, and carrier-neutral operators (CNNOs). The report assesses energy consumption trends alongside revenues and other metrics, and highlights energy efficiency tactics being implemented by key operators. The analysis is based on a bottoms-up review of sustainability-related data and reports from 101 operators, accounting for nearly 90% (by revenues) of the entire industry of network operators: 17 webscalers, 29 carrier-neutral operators (CNNOs), and 55 telecom operators (telcos). Coverage timeframe is 2019-22. Energy consumption is defined to include both electricity and fuels such as diesel and natural gas.
Network operators of all stripes are under pressure to reduce their carbon emissions and progress rapidly towards net zero. They are also concerned with reducing their energy spending. As such, there is a lot of well-deserved attention paid to energy consumption patterns in the network operator industry. Operators across segment lines are exploring a range of tactics to reduce their energy consumption or slow its rate of growth.
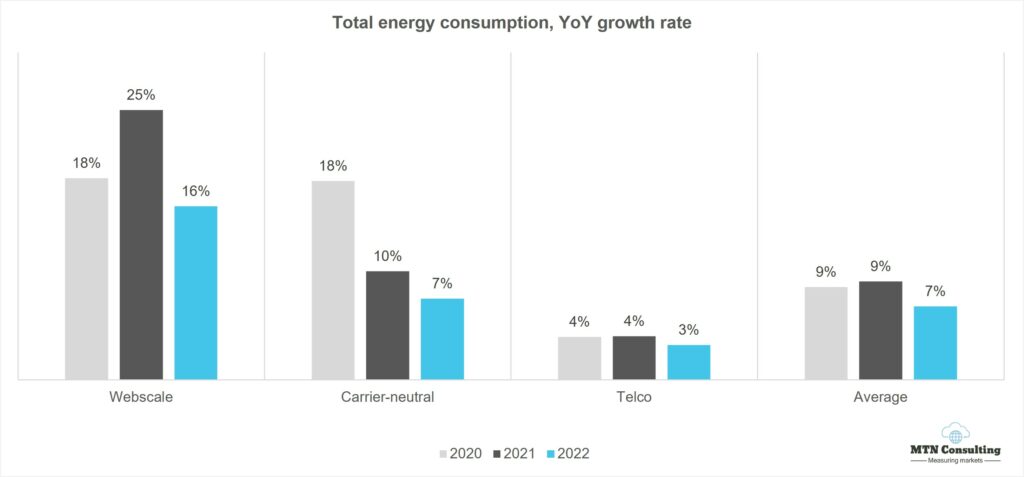
For 2022, we estimate that network operators consumed the equivalent of 543.6 terawatt hours (TWh) of energy, up 7% YoY; 88% of total energy consumed was derived from electricity. The 7% annual growth in 2022 is a bit slower than the 9% growth achieved in both 2020 and 2021. Webscale energy consumption grew the fastest in 2022, up 16% YoY, pushing up the sector’s share of total energy consumption by network operators to 25.1%. Telco energy consumption grew the slowest, up just 3% from 2021, pushing down the sector’s share to 60.5%. Carrier-neutral operators are by far the most energy intensive, but overall the CNNO segment consumed just 7% more energy in 2022 than the prior year, keeping the sector’s share of total energy flat at a bit over 14%.
Energy consumption per unit of revenue, or energy intensity, is one useful metric. Across operator segments, energy intensity averaged out to 127 MWh consumed per US$1 million in revenues in 2022, a bit higher than 2021; the uptick is due largely to telcos. Telcos consumed an average of 186MWh per $1M in revenue in 2022, up from 169 MWh/$M in 2021. That trend is a bit worrisome, as: telcos need to cut opex anywhere they can, including energy; they have low rates of renewable energy use, and high emissions; and, energy intensity should be flat to down over time, especially for telcos slimming down their asset base. Many telcos prefer to focus on traffic intensity, i.e. energy consumed per unit of traffic, which is going down steadily over time for the whole industry – but that doesn’t tell the whole story.
Energy intensity varies widely across our database. Within the telco sector, the most energy intensive was LG Uplus, which consumed 782MWh per $1M in revenue in 2022, while the least energy intensive was Swisscom at 45MWh. Swisscom is widely regarded as a top performer among telcos in its sustainability practices and reporting; its energy intensity has hovered around 45 steadily since 2016. In the webscale sector, Yandex’s 121MWh/$M was highest in 2022, followed closely by Meta’s 101 MWh/$M; Cognizant consumed just 9MWh. Changes over time in energy intensity among webscalers have come from deployment of cloud services, and a greater or lesser reliance on owned data centers. In the carrier-neutral segment, China’s two emerging data center-focused players are by far the most energy intensive: ChinData and GDS consumed 4,586MWh and 3,528 MWh per $1M of revenue in 2022. Digital Realty, a more established CNNO focused on data centers, is also high; it recorded 2,255MWh of energy consumption per US$1M in revenues. Tower-focused CNNOs consume relatively little: US-based Crown Castle and SBA Communications consumed just 32 and 27 MWh per $1M in revenue in 2022.
- Table Of Contents
- Figures and Tables
- Coverage
- Visuals
Table Of Contents
- Summary – page 2
- Energy consumption includes more than electricity – 3
- Energy consumption driven by networks, but networks differ – 3
- Operator energy consumption grows 7% YoY in 2022 – 4
- Top 15 operators account for 46% of industry energy consumption – 5
- Operator revenues flat at ~$4.1 trillion in 2022, pushing up energy intensity – 6
- Energy intensity variations across three key segments – 7
- Biggest improvements in energy intensity – 8
- Energy consumption is closely connected to physical asset base – 10
- Snapshot of energy efficiency projects – 11
- Conclusion – 12
- Appendix – 13
Figures and Tables
Figure 1: Electricity as a % of total energy consumption by operator type
Figure 2: Total energy consumption by operator type, GWh
Figure 3: Total energy consumption by segment, YoY growth rate
Figure 4: Breakdown of 2022 energy consumption by key operator
Figure 5: Energy intensity by operator type (MWH per US$M revenue)
Figure 6: Energy intensity (MWh per $M in revenue) in 2022: top 5 results for each segment
Figure 7: Biggest improvements (i.e. reductions) in energy intensity, 2019-22
Figure 8: Energy intensity time series for three sample telcos, 2016-22 (MWh/$1M in revenue)
Figure 9: Energy consumption in MWh per US$M of Net PP&E on the books (MWh/$M)
Table 1: Energy efficiency tactics cited by operators with declining energy intensity for 2019-22
Coverage
Operators covered:
21vianet
Advanced Info Service (AIS)
Airtel
Alibaba
Alphabet
Amazon
America Movil
American Tower
Apple
AT&T
Axiata
Baidu
BCE
BT
Cellnex
Charter Communications
China Mobile
China Telecom
China Tower
China Unicom
ChinData
Chorus Limited
Chunghwa Telecom
CK Hutchison
Cogent
Cognizant
Comcast
CoreSite Realty
Crown Castle
CyrusOne
Cyxtera
Deutsche Telekom
Digital Realty
ebay
EI Towers
Entel
Equinix
Etisalat
Fujitsu
GDS Data Centers
Globe Telecom
Grupo Televisa
Helios Towers
HPE
IBM
IHS Towers
Iliad SA
Indus Towers
Inwit
JD.com
KDDI
Keppel DC Reit
KPN
KT
Level 3
LG Uplus
Liberty Global
Lumen Technologies
Meta (FB)
Microsoft
Millicom
MTN Group
NBN Australia
NextDC
NTT
Ooredoo
Oracle
Orange
PCCW
PLDT
Proximus
QTS Realty
Rogers
SAP
SBA Communications
Singtel
SK Telecom
SMN (Protelindo)
STC (Saudi Telecom)
Sunevision
Swisscom
Switch
Taiwan Mobile
TDS
Telecom Argentina
Telecom Italia
Telefonica
Telenor
Telia
Telkom Indonesia
Telstra
Telus
Tencent
Tower Bersama
True Corp
Turk Telekom
Verizon
Vodafone
Windstream
Yandex
Zain
Visuals