By Matt Walker
The goal of this report series is to equip telecom industry decision-makers with a comprehensive view of spending trends and vendor market power in their industry. To do this we assess technology vendors’ revenues in the telecom vertical, across a wide range of company types and technology segments. We call this market “telco network infrastructure”, or “Telco NI.” This study tracks 132 Telco NI vendors, providing revenue and market share estimates for the 1Q13-2Q22 period. Of these 132 vendors, 108 are actively selling to telcos; most others have been acquired by other companies in the database.
Telco capex on an upswing, lifting Telco NI vendor revenues
Despite stalled revenue growth and macro pressures, telcos continue to go on a spending spree. For the annualized 2Q22 period, telco capex was $329.5B, while the ratio of capex to revenues (i.e. capital intensity) was 17.8%. Both figures represent new record highs, at least for the 46 quarter period (11.5 years) that MTN Consulting covers (1Q11-2Q22).
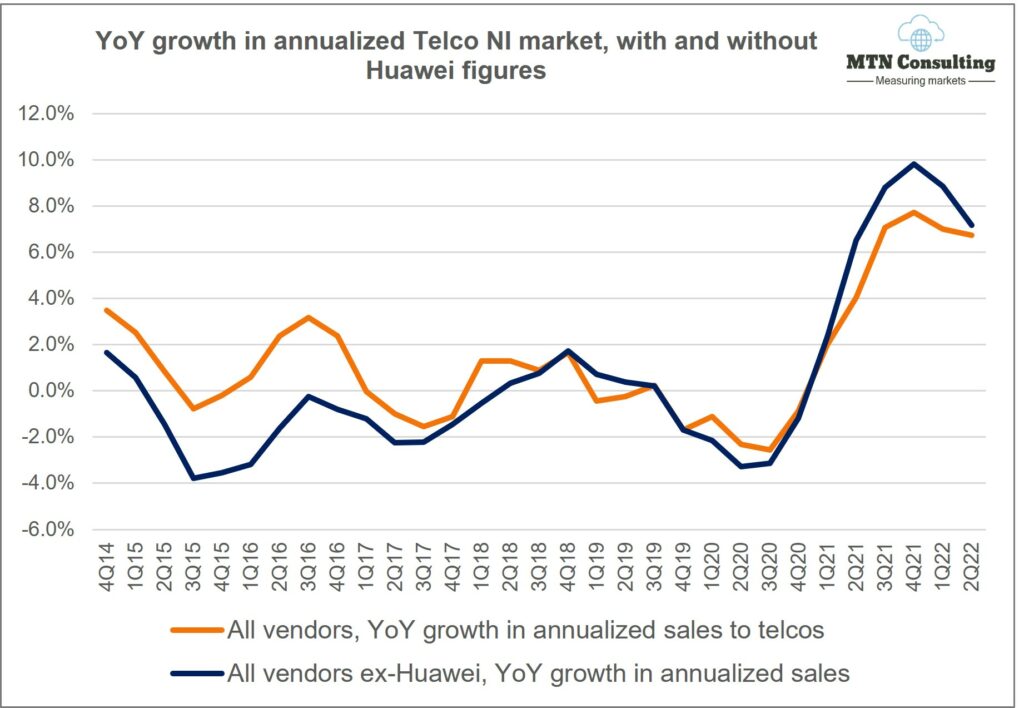
Similarly, the Telco NI market has also been rising. On a single quarter basis, Telco NI revenues have increased YoY for each of the last 7 quarters. In 2Q22, vendors’ Telco NI revenues grew by 4.1% YoY, to $60.1B; annualized revenues for 2Q22 grew 6.7% from the 2Q21 period, to hit $237.6B. This growth comes despite continued supply chain constraints impacting several significant product areas, inflation pressures, and a challenged macroeconomic climate.
What’s behind recent spending growth
One factor behind the recent capex spending spike is a post-COVID bump. There are other factors, however. Many telcos are scaling up initially small 5G deployments, and beginning to build out 5G SA core networks. 5G RAN builds have been underway for several years, but the spending has been small to start due both to the software-centric nature of 5G networks and telcos’ desire to wait for new revenue models to emerge. Incidentally, a shift to 5G core spending tends to benefit a different type of vendor – cloud providers AWS, Azure and GCP, for instance, are all actively involved in helping telcos with 5G core migrations. Their collective revenues in the telco vertical were about $3.4B for the 12 months ended June 2022, up nearly 80% YoY. Many of the vendors involved in this are less vulnerable to supply chain issues.
Another plus: fiber spending is strong in a number of markets, especially the US but also in Europe, Australia, China, and India. That’s to support FTTx deployments but also to connect together all the new radio infrastructure needed to support 5G. Government subsidies and other investment incentives are a factor as well. Vendors focused on fiber optics are seeing strong growth right now. For instance, Corning and Clearfield saw their telco vertical revenues grow by 25% and 84% YoY in 2Q22, respectively.
Supply chain limitations have a mixed effect. They sometimes mean delay or cancellation of projects, which cuts capex in the short term. They also can mean price increases, though, as telcos push suppliers to accelerate timelines or adjust designs to work with available alternatives. This can result in projects costing more than expected. Let’s not forget, though, that a huge portion of telco spend is unaffected by current supply chain constraints. Services- and software- focused vendors – like Accenture, Amdocs, IBM, Infosys, TCS and Tech Mahindra – are not citing supply chain issues as a drag on results.
Finally, there’s China. Given how closed a market this is, there’s not as much attention paid to it nowadays. But China’s capex has been growing recently. For the 2Q22 annualized period, Chinese telco capex totaled $58.3B, up 12% from 2Q21. That growth comes despite efforts to share costs on the network side.
China’s capex growth is relevant to vendor share. Huawei continues to rank at the top of the global telco network infrastructure (telco NI) market. For the 2Q22 annualized period, we estimate its telco NI share at 18.7%, far ahead of Ericsson (10.9%) and Nokia (8.9%). Huawei’s stability is no mystery. It’s dominant at home, and local telcos have been spending big, and steering more of their capex dollars to local suppliers over the last couple of years. Huawei also has a huge customer list overseas – these revenue streams don’t just disappear overnight, especially since many telcos remain loyal to the vendor. In addition to Huawei, several other Chinese vendors have seen share improvements recently, including Hengtong, Fiberhome, ZTE, YOFC, and China Comservice.
Biggest recent market share and revenue changes
Comparing 2Q22 annualized market share with 2Q21, the biggest improvements in the market were seen at Intel, Microsoft and Corning, due to strong telco adoption of their virtualization/edge compute, cloud collaboration and fiber cabling solutions, respectively. The biggest share declines were seen at Ericsson, Nokia and NEC; a shift from 5G RAN to core spend impacted the first two, while weaker Japanese telco capex hit NEC.
On a revenue basis, the biggest gains seen in 2Q22 were at the three cloud providers (Microsoft/Azure, Amazon/AWS, and Alphabet/GCP), and small fiber optics specialist Clearfield. Other gainers were Harmonic and several fiber companies (Westell, Corning, and Sterlite). Vendors which reported significant YoY revenue declines in the 2Q22 annualized period include Airspan, Casa Systems, Tejas Networks, NEC, and Subex; all are highly exposed to the spending whims of a small number of geographic markets or company accounts.
Spending outlook
Most large vendors appear to be cautiously optimistic about the spending outlook in Telco NI. On Nokia’s 2Q22 earnings call, the CEO presented a view which is typical of many key vendors: “we continue to see strong investment trends in connectivity, particularly into 5G and fiber deployments…But the macro trends could impact the pace at which our customers are investing…the most important thing for us as a company is to make sure we do not become complacent.”
MTN Consulting expects the market may start to flatten in the next few quarters. Telco capex – the main driver of Telco NI – is likely to end 2022 at $331B, in line with the $330B spent in the latest (3Q21-2Q22) annualized period. Many vendors continue to expect supply chain issues to persist for at least a quarter or two more, impacting equipment. That will restrain spending slightly in some areas, but 2023 should be back on track — absent a new deadly, highly contagious virus, war in the South China Sea, or some other low probability but disastrous event.
Telco headcount reductions have been a bit more aggressive lately than we expected: total employees in the telco industry were 4.598M as of June 2022, already lower than the 4.634M we had expected for year-end 2022. This workforce reduction can benefit vendors, such as those offering managed services and automation software. Telcos continue to search for ways to reduce opex, especially in the network, and while that’s bad for employees it opens up opportunities for vendors.
- Table of Contents
- Figures
- Coverage
- Visuals
Table of Contents
- ABSTRACT – Results commentary
- Telco NI Market – Latest Results
- TOP 25 VENDORS – Printable tearsheets
- CHARTS – Single vendor snapshot
- CHARTS – 5 vendor comparisons
- R&D spending by vendors
- DATA – revenue estimates by company
- Methodology & Assumptions
- ABOUT – MTN Consulting
Figures
Partial list:
- Annualized Telco NI vendor revenues ($B) vs. YoY growth in annualized sales
- YoY growth in annualized Telco NI market, with and without Huawei figures
- All vendors, YoY growth in single quarter sales
- Telco NI vendor revenues by company type, TTM basis (US$B)
- Telco NI revenues by company type: YoY % change
- Telco NI revenue split: Services vs. HW/SW
- Telco NI sales of top 10 vendors vs. all others, 2Q22 TTM (annualized)
- Top 25 vendors based on annualized Telco NI revenues through 2Q22 ($B)
- Top 25 vendors based on Telco NI revenues in 2Q22 ($B)
- Key vendors’ annualized share of Telco NI market
- Telco NI market share changes, 2Q22 TTM vs. 2Q21 TTM
- Telco NI annualized revenue changes, 2Q22 vs. 2Q21
- YoY growth in Telco NI revenues (2Q22)
- Top 25 vendors in Telco NI Hardware/Software: Annualized 2Q22 Revenues (US$B)
- Top 25 vendors in Telco NI Services: Annualized 2Q22 Revenues (US$B)
- R&D spending as a percent of revenues for key telco-focused vendors (3Q21-2Q22)
Coverage
| Company | Segment |
| 3M | CCV |
| A10 Networks | NEP |
| Accenture plc | ITSP |
| Accton Technology | NEP |
| ADTRAN | NEP |
| ADVA Optical Networking | NEP |
| Affirmed Networks | NSP |
| Airspan | NEP |
| Alcatel-Lucent | NEP |
| Allied Telesis | NEP |
| Allot Communications | NEP |
| Alphabet | NSP |
| Altran Technologies | ITSP |
| Amazon | NSP |
| Amdocs | ITSP |
| Anritsu | T&M |
| Arista Networks | NEP |
| ARRIS International | CCV |
| AsiaInfo Technologies | NSP |
| Atos Origin | ITSP |
| Audiocodes | NSP |
| Avaya | ITSP |
| Aviat Networks | NEP |
| Beijing Xinwei | NEP |
| Broadcom Limited | NEP |
| BroadSoft, Inc. | NSP |
| Brocade Communications Systems, Inc. | NEP |
| CA Technologies | NSP |
| Calix | NEP |
| Capgemini | ITSP |
| Casa Systems | NEP |
| Ceragon Networks | NEP |
| Check Point Software | NSP |
| China Comservice | ES |
| Ciena Corporation | NEP |
| Cisco Systems | NEP |
| Citrix Systems | ITSP |
| Clearfield | CCV |
| Comarch | ITSP |
| Comba Telecom | NEP |
| CommScope Holding | CCV |
| Commvault Systems | ITSP |
| Comptel | NSP |
| Convergys | ITSP |
| Coriant | NEP |
| Corning | CCV |
| CSG | NSP |
| Cyan | NSP |
| DASAN Zhone | NEP |
| Datang Telecom Technology | NEP |
| Dell Technologies | NEP |
| DragonWave Inc. | NEP |
| DXC Technology (aka CSC) | ITSP |
| DyCom Industries | ES |
| ECI Telecom | NEP |
| Ericsson | NEP |
| EXFO Inc | T&M |
| Extreme Networks | NEP |
| F5 Networks | ITSP |
| Fiberhome | NEP |
| FireEye | NSP |
| Fortinet | ITSP |
| Fujikura | CCV |
| Fujitsu Limited | NEP |
| Furukawa Electric | CCV |
| General Cable | CCV |
| Harmonic Inc. | NEP |
| HCL Technologies | ITSP |
| Hengtong Optic-electric | CCV |
| Hitachi | NEP |
| HPE | ITSP |
| Huawei | NEP |
| Huber+suhner AG | CCV |
| IBM | ITSP |
| Infinera | NEP |
| Infosys | ITSP |
| Inseego | NEP |
| Intel | NEP |
| Italtel | NEP |
| ITOCHU Techno-Solutions Corporation | ES |
| Juniper Networks | NEP |
| Kathrein | CCV |
| Kudelski | NEP |
| Kyndryl Holdings | ITSP |
| MasTec | ES |
| Mavenir | NSP |
| Metaswitch | NSP |
| Microsoft | NSP |
| Mitsubishi Electric | NEP |
| NEC Corporation | NEP |
| Net Insight | NEP |
| Netcomm | NEP |
| NetScout Systems | NSP |
| Nexans | CCV |
| Nokia | NEP |
| Openet | NSP |
| OPTIVA | NSP |
| Oracle | NSP |
| Pace plc | NEP |
| Palo Alto Networks | NEP |
| Prysmian | CCV |
| Quantenna Communications | NEP |
| Radcom | NSP |
| Radisys | NSP |
| Radware | NEP |
| Red Hat | NSP |
| Ribbon Communications | NEP |
| Ruckus Wireless | NEP |
| Samsung Electronics | NEP |
| SAP SE | NSP |
| SeaChange International, Inc. | NSP |
| Sopra Steria | ITSP |
| Spirent Communications | T&M |
| Sterlite Technologies | CCV |
| Subex | NSP |
| Sumitomo Electric | NEP |
| SYNNEX Corporation | ITSP |
| Tata Consultancy Services | ITSP |
| TE Connectivity | CCV |
| Tech Mahindra | ITSP |
| Technicolor | NEP |
| Tejas Networks | NEP |
| Transmode | NEP |
| Trigiant Group | CCV |
| Virtusa | ITSP |
| VMWare | NSP |
| Vubiquity | ITSP |
| Westell | CCV |
| Wipro | ITSP |
| Wiwynn | NEP |
| YOFC | CCV |
| ZTE | NEP |
Visuals