By Arun Menon
This market review provides a comprehensive assessment of the global telecommunications industry based on financial results through December 2021 (4Q21). The report tracks revenue, capex and employee for 138 individual telecommunications network operators (TNOs). For a sub-group of 79 large TNOs, the report also assesses labor cost, opex and operating profit trends. The report also covers annual data for other financial metrics such as debt, cash & short term investments, M&A spend and cash flow from operations for all the 79 companies from the TNO-79 subset. Our coverage timeframe spans 1Q11-4Q21 (44 quarters). The report’s format is Excel.
ABSTRACT
4Q21 RESULTS SUMMARY
Final quarter decline tapers full-year topline growth to 5.3%
After four growth quarters propelled by a pandemic-induced low base period, non-service revenues, and exchange rate fluctuations, the telecom network operator (telco) market witnessed revenue decline in the latest quarter. For the single quarter 4Q21, telco revenues declined by 1.3% on a YoY basis to post $472 billion (B). Revenues for the full-year 2021, though, were $1,888.3B, up 5.3% YoY, the strongest revenue growth experienced in a decade. Much of the revenue growth, however, is due to a bounce back from the COVID doldrums. Data from the largest mobile telcos also suggest revenues from non-services (5G handset devices and CPE) contributing to the annual revenue bump. For instance, AT&T’s equipment revenues grew by 18.3% in 2021, but service revenues declined by 4.2%.
At the operator level, five of the top 20 best performing telcos by topline in 4Q21 posted double-digit growth on an annualized basis. These include China Telecom (19.4% YoY vs. annualized 4Q20), China Mobile (18.1%), Dish Network (15.4%), China Unicom (15.3%), and Deutsche Telekom (11.3%). By the same criteria, the worst telco growth came from Softbank (-11.0%) during the same period. Telefonica and AT&T were the only other two operators among the top 20 to post a decline in revenues. While the big swings at Deutsche Telekom and Softbank are due to the former closing its acquisition of Sprint from Softbank in April 2020, growth witnessed by other operators was mostly an outcome of low base effect in the previous quarters. Another factor for some operators is non-service revenues, as these have grown with 5G device sales in many markets. Telcos now hope that the 5G-enabled devices already deployed will help to generate new revenue streams in 2022 and beyond. But that seems unlikely as a major chunk of the growth is expected to come from device sales.
10% jump propels capex to hit record $326B in 2021
Single-quarter capex jumped at a robust growth rate of 10% on a YoY basis, totaling $92.5B in 4Q21. Telco investments surged by ~10% YoY for the third successive quarter, as the desire to deploy 5G network capability remained strong. Telcos are spending heavily to upgrade networks to 5G, with a growing number beginning deployment of stand-alone 5G core networks, often relying on collaboration with webscale operators like AWS, Azure and GCP for key functions. Since capex grew faster than revenues in 2021, the market’s capital intensity rose, from 16.5% in 2020 to 17.3% in 2021. This 17.3% is the same as was recorded in 2015, during the peak of the LTE build cycle. At the operator level, Globe Telecom’s capital intensity for the annualized 4Q21 period stood at 55.2%, the highest among established operators. Globe’s figure is due to a network infrastructure buildup that includes 1,080 new cell sites, upgrades to at least 12,900 sites including both 4G LTE and 5G, and installation of over one million fiber-to-the-home lines. PLDT’s annualized capital intensity also hovered around 53% in 4Q21, as spending ramped both for meeting connectivity demands and taking on new competition from the new mobile player Dito Telecommunity Corp. The capex climb was also due to telcos choosing from a smaller set of suppliers than in previous years: the US-sponsored entity list has severely limited opportunities outside China for Huawei, which is still the world’s largest telecom vendor. Less competition frequently means higher prices.
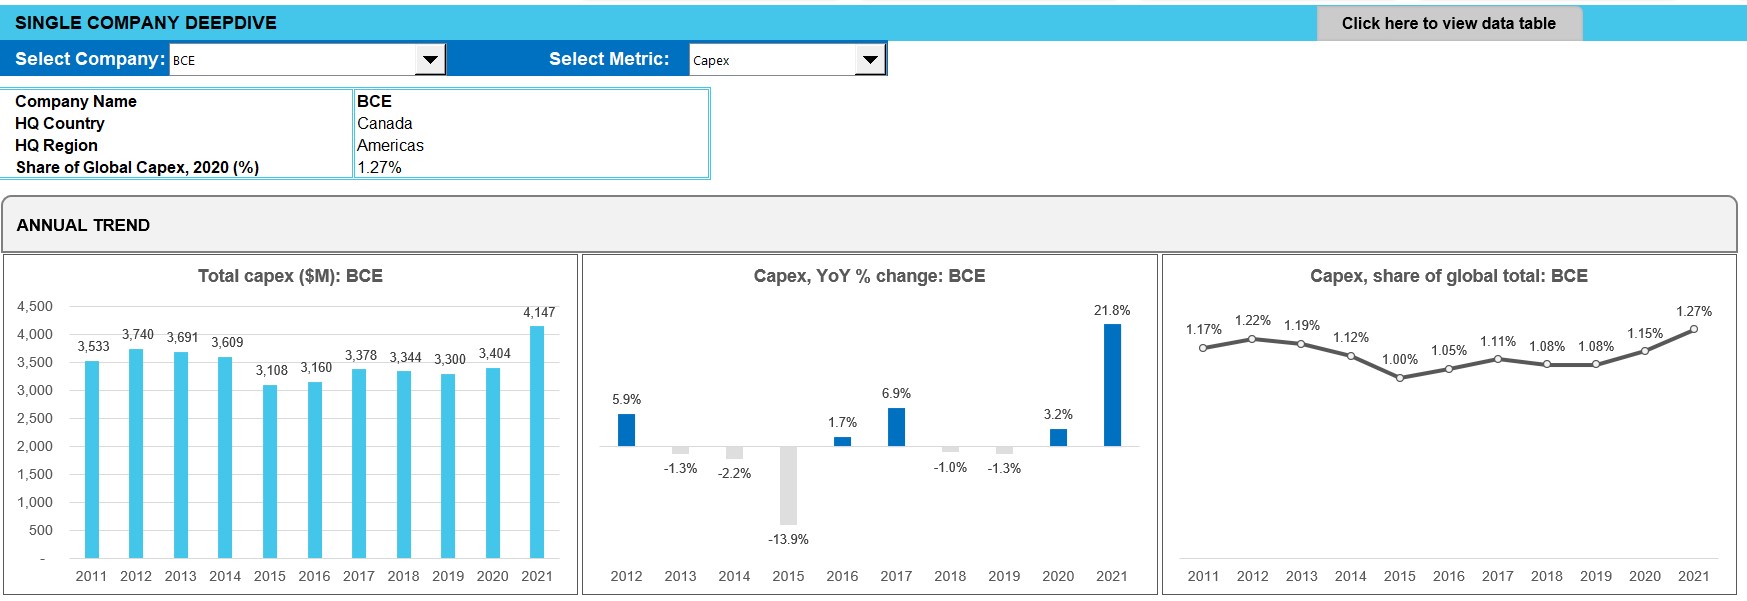
The biggest capex spender in 4Q21 on a single quarter and annualized basis was China Mobile. This was despite the company’s YoY growth of just 3.3% in the annualized 4Q21 period, enabled by China Mobile’s network partnership with China Broadcasting Network. Nine out of the top 20 operators by annualized capex spend posted double-digit growth rates in the period ended 4Q21. Some of these include: Telecom Italia (70.2% YoY vs. annualized 4Q20), America Movil (54.6%), Rakuten (46.5%), BT (39.6%), CK Hutchison (38.0%), China Unicom (30.6%), BCE (21.8%), Orange (11.8%), and Verizon (11.5%). On an annualized capital intensity basis, Rakuten beats all other telcos handily with a roughly 210.9% capex/revenue ratio for the quarter; its greenfield network rollout is reaching its peak. Other capital intensity standouts include: Globe Telecom (55.2%), PLDT (52.8%), and Oi (40.4%).
Software-based digital transformation and automation to drive telco profitability
Historically, telcos have maintained stable profitability margins – EBIT margins have been in the range of 13-18% while EBITDA margins have never gone down below 30% since 2011. This trend continues to stretch out into 2021. Operating margins for the full year 2021 stood at 15.1%, up from 14.4% in the prior year. EBITDA margins remained stable at 33.4% in 2021, maintaining the peak level achieved in 2020. Labor costs as a percentage of opex ex-D&A have been rising again after moderating briefly in the past few quarters, which means they are not directly causing this margin growth. Rather, within the overall telco opex budget, telcos are having success in cutting their sales & marketing and G&A spending, as telcos adjust to working from home and accelerate the migration of sales & support to digital platforms. These efforts accelerated in 2020, as COVID-19 spread and telcos were forced to do business with minimal human intervention, but have continued in 2021. Meanwhile, many telcos are reporting that network operations is taking up a larger portion of the opex pie. Managing costs is core to telcos’ willingness to partner with webscale providers, whose sales of software licenses to telcos are growing, posing a grave challenge to the more traditional telco-centric vendors like Cisco and Nokia.
Industry headcount continues to be on a downward spiral despite rise in labor costs
Telco industry headcount continues to decline, falling to 4.693 million at the end of 2021, down from 4.787 million a year ago. MTN Consulting expects headcount reductions to continue via attrition and voluntary retirement schemes, heading towards 4.5 million by 2025. Even as telcos cut headcount, they recognize how key their workforce is to success. As such they are investing in training programs, and hiring a new generation of highly-skilled employees able to function in the telco of 2022. Data from 4Q21 verifies that telcos’ average labor costs per employee are rising as telcos make this transition – annualized labor costs per employee increased to $57.6K in 4Q21 from $53.6K in 4Q20. MTN Consulting expects the average telco employee salary to continue rising.
Asia emerges as a bright spot in 2021, but capex growth strongest in the Americas
Regionally, all but Asia were a mixed bag – MEA region topped revenue growth among the four major regions in 4Q21, but was also the only to post declines in capex. Similarly, revenues for Europe and the Americas declined YoY but posted growth in capex in the latest quarter. The Americas region maintained its stronghold as the largest single region (37.6%) on a revenue basis, but Asia is catching up fast with its share trailing by just 1.6 ppts at 36.0% in 4Q21. On a capex basis, the Asia region has been outspending the Americas for many years but the Americas region posted a robust 21.0% YoY capex growth in the latest quarter. Europe’s capex growth was the second best at 7.1%, courtesy of a late start to 5G spending due to delayed spectrum auctions, coupled with increased efforts in FTTH deployments and government-supported rural rollouts. Europe’s annualized capital intensity of 19.2% (4Q20: 17.4%) was also the highest among the four regions in 4Q21, surpassing Asia’s annualized capital intensity of 18.6%. Europe’s 2021 capital intensity was its highest in at least a decade. This surge was a direct result of 5G buildouts, many of which were delayed from 2020 due to COVID shutdowns and spectrum auction delays.
- Table Of Contents
- Figure & Charts
- Coverage
- Visuals
Table Of Contents
- Abstract
- Market snapshot
- Analysis
- Key stats through 4Q21
- Labor stats
- Operator rankings
- Company Deepdive & Benchmarking
- Country breakouts
- Country breakouts by company
- Regional breakouts
- Raw Data
- Subs & traffic
- Exchange rates
- Methodology & Scope
- About
Figure & Charts
- TNO market size & growth by: Revenues, Capex, Employees – 4Q19-4Q21
- Regional trends by: Revenues, Capex – 4Q17-4Q21
- Opex & Cost trends
- Labor cost trends: 4Q19-4Q21
- Profitability margin trends: 4Q19-4Q21
- Spending (opex, labor costs, capex): annual and quarterly trend
- Key ratios: annual and quarterly trend
- Workforce & productivity trends: 1Q14-4Q21
- Operator rankings by revenue and capex: latest single-quarter and annualized periods
- Top 20 TNOs by capital intensity: latest single-quarter and annualized periods
- Top 20 TNOs by employee base: latest single-quarter
- TNOs: YoY growth in single quarter revenues
- TNOs: Annualized capital intensity, 4Q15-4Q21
- TNOs: Revenue and RPE, annualized 4Q15-4Q21
- TNOs: Capex and capital intensity (annualized), 4Q15-4Q21
- TNOs: Total headcount trends, 4Q15-4Q21
- TNOs: Revenue and RPE trends, 2011-21
- TNOs: Capex and capital intensity, 2011-21 ($ Mn)
- TNOs: Capex and capital intensity, 4Q15-4Q21 ($ Mn)
- TNOs: Revenue and RPE trends, 4Q15-4Q21
- Top 79 TNOs by total opex, 4Q21
- Top 79 TNOs by labor costs, 4Q21
- TNOs: Software as % of total capex
- TNOs: Software & spectrum spend
- TNOs: Total M&A, spectrum and capex (excl. spectrum)
- Top 79 TNOs by total debt: 2011-21
- Top 79 TNOs by total net debt: 2011-21
- Top 79 TNOs by long term debt: 2011-21
- Top 79 TNOs by short term debt: 2011-21
- Top 79 TNOs by total cash and short term investments ($M): 2011-21
Coverage
Operator coverage:
| A1 Telekom Austria | Advanced Info Service (AIS) | Airtel | Altice Europe | Altice USA | America Movil | AT&T | Axiata | Axtel | Batelco |
| BCE | Bezeq Israel | Bouygues Telecom | BSNL | BT | Cable ONE, Inc. | Cablevision | Cell C | Cellcom Israel | CenturyLink |
| Cequel Communications | Charter Communications | China Broadcasting Network | China Mobile | China Telecom | China Unicom | Chunghwa Telecom | Cincinatti Bell | CK Hutchison | Clearwire |
| Cogeco | Com Hem Holding AB | Comcast | Consolidated Communications | Cyfrowy Polsat | DEN Networks Limited | Deutsche Telekom | Digi Communications | DirecTV | Dish Network |
| Dish TV India Limited | DNA Ltd. | Du | EE | Elisa | Entel | Etisalat | Fairpoint Communications | Far EasTone Telecommunications Co., Ltd. | Frontier Communications |
| Globe Telecom | Grupo Clarin | Grupo Televisa | Hathway Cable & Datacom Limited | Idea Cellular Limited | Iliad SA | KDDI | KPN | KT | Leap Wireless |
| LG Uplus | Liberty Global | M1 | Manitoba Telecom Services | Maroc Telecom | Maxis Berhad | Megafon | MetroPCS Communications | Millicom | Mobile Telesystems |
| MTN Group | MTNL | NTT | Oi | Omantel | Ono | Ooredoo | Orange | PCCW | PLDT |
| Proximus | Quebecor Telecommunications | Rakuten | Reliance Communications Limited | Reliance Jio | Rogers | Rostelecom | Safaricom Limited | Sasktel | Shaw |
| Singtel | SITI Networks Limited | SK Telecom | Sky plc | SmarTone | SoftBank | Spark New Zealand Limited | Sprint | StarHub | STC (Saudi Telecom) |
| SureWest Communications | Swisscom | Taiwan Mobile | Tata Communications | Tata Teleservices | TDC | TDS | Tele2 AB | Telecom Argentina | Telecom Egypt |
| Telecom Italia | Telefonica | Telekom Malaysia Berhad | Telenor | Telia | Telkom Indonesia | Telkom SA | Telstra | Telus | Thaicom |
| Time Warner | Time Warner Cable | TPG Telecom Limited | True Corp | Turk Telekom | Turkcell | Veon | Verizon | Virgin Media | Vivendi |
| Vodafone | Vodafone Idea Limited | VodafoneZiggo | Wind Tre | Windstream | Zain | Zain KSA | Ziggo |
Regional coverage:
| Asia | Americas | Europe | MEA |
Visuals