By Matt Walker
Introduction
Revenues for the webscale sector of network operators ended 2021 at $2.14 trillion. That’s up 25% from 2020, and nearly 3x the total recorded in 2011. One reason for this is a dramatic uptick in cloud services revenues: cloud revenues for the top 3 (AWS, GCP and Azure) climbed 42% YoY, to $120.3B (per MTN Consulting). Still, this accounts for less than 6% of total webscale sector revenues. Larger factors behind 2021’s growth include: digital ad revenues for Alphabet and Facebook (Meta); ecommerce sales at Amazon, JD.Com, and Alibaba; and, 5G device revenue sales at Apple. The webscale sector is now comfortably larger than telecom, which recorded just under $1.9 trillion in 2021 revenues.
On a capex basis, telecom remains far ahead, with nearly $325B in 2021 annualized capex, or nearly double the webscale total of $175B. But webscale is gradually bridging this gap: in 2021, webscale capex spiked 30% YoY, versus an approximate 10% rise for telco capex. Capex in 4Q21 for webscalers was $50B, up 23% YoY. Webscalers also invest heavily in R&D, and have bleeding-edge requirements for the technology they deploy in their network. That has led them to drive the creation of many new innovations in network infrastructure over the last few years. These span semiconductors, optical transmission and components, intent-based routing, network automation, and other areas. Facebook (Meta) is perhaps the most influential of all webscalers due in part to its openness and support for the OCP and TIP organizations.
Asia Pacific records best recent revenue growth in 2021
Regionally, the strongest growth in 2021 was in Asia Pacific, where revenues grew 29% YoY. The more mature Americas region lagged, with growth of just over 21% YoY. That pushed Americas down to about 44% of global webscale revenues, from 45% in 2020. Asia Pacific follows, with a 36% global revenue share, then Europe (17%) and MEA (3%). The Americas still account for the majority of webscale capex, with the US at the center. For instance, both Alphabet and Facebook (Meta) say well over 70% of their “long-lived assets” are in the US. Going forward, the non-US portion should rise as the cloud providers within the webscale market build out their global data center footprints. In January 2022, for example, AWS launched its first data center in Jakarta, Indonesia, and is planning a new region in Mexico.
Profitability still relatively high, but weaker than 2020
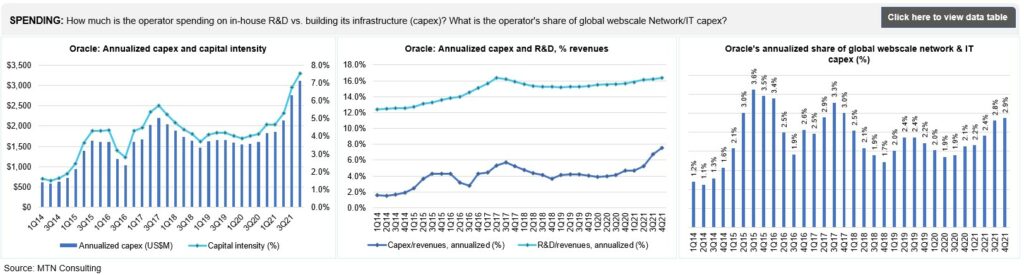
Using a standardized definition of free cash flow (cash from operations less capex), the webscale sector’s FCF was $347.4B in 2021, or 16.2% of revenues. That is down significantly from a 19.7% margin in 2020. This ratio is still high relative to many sectors, however. The decline is due largely to a webscaler choice to accelerate capex during the COVID dislocation; that should pay off over the long run. Oracle, for instance, saw its FCF drop from 30.8% in 2020 to 17.2% in 2021, due mainly to its rapid cloud expansion. Nonetheless, Oracle says it will continue capex at a roughly $1B per quarter run rate, as it aspires to be the fourth major cloud provider with global scope. Amazon is actually the worst hit company in terms of FCF margin drop, due directly to its enormous 2021 capex outlays: Amazon’s FCF in 2021 was -3.1%, from 6.7% in 2020. Amazon, however, says its 2022 infrastructure (AWS) capex will likely rise.
Cash on hand, including short-term liquid investments, amounted to $747B for the webscale sector at the end of 4Q21, down 2% from the end of 2020. Total debt increased by 7%, to $518B. As a result, net debt (debt minus cash) in Dec. 2021 was -$228B for the webscale sector, from -$280B in December 2020. The companies with the biggest stockpiles of cash (and equivalents) are Alphabet ($139.6B), Microsoft ($125.4B), Amazon ($96.0B), and Apple ($63.9B). Facebook has just $48B, but no debt at all. Apple, IBM, and Oracle all have significantly more debt than cash.
Top 8 webscalers remain the biggest spenders, but Oracle and Twitter also important
This webscale tracker considers a “Top 8” group of companies as being, traditionally, the most influential in the market’s overall technology development and investments. These include three Chinese Internet companies (Alibaba, Baidu and Tencent), the world’s leading smartphone provider (Apple), the world’s biggest social media company (Facebook), and the leading three cloud providers: Alphabet, Amazon, and Microsoft. Ranking webscalers based on their share of tech capex, Amazon tops the list easily, accounting for 27.0% of network/IT capex in 2021. Amazon is followed by Alphabet (16.2%), Microsoft (14.0%), Facebook (10.0%), Tencent (6.3%), Apple (5.0%), Alibaba (4.1%), Oracle (2.9%), Baidu (2.1%), IBM (1.7%), HPE (1.5%), and Twitter (1.3%). Amazon’s recent capex surge is well known, and has supported expansion of the company’s AWS footprint and service offerings. Oracle has been quieter but its capex growth is equally impressive, from a smaller base: 2021 capex was $3.1B, up 70% from 2020. Twitter, a new addition to our webscale coverage, spends more on network/IT capex as a percentage of revenues (over 19%) than all other webscalers, due to ongoing software development and construction of its first owned data center.
The facilities these webscale players are building can be immense. For instance, Microsoft started construction recently on two new data centers in Des Moines Iowa, each of which costs over $1B and measures over 167K square meters (1.8 million square feet). These two are part of a cluster in the area, as is often the case; Microsoft already has three facilities around Des Moines. Facebook is working on a project in DeKalb, Illinois, roughly half the size at 84.2K square meters, costing US$800M and spreading across 500 acres of land. This construction project was announced in 2020 but won’t complete until 2023. These are just two examples of the many big facilities in the works in the webscale sector.
Who benefits from webscale capex?
The network spending of big webscalers is centered around immense, “hyperscale” data centers and undersea cable systems that support network traffic from the tech companies’ online retail, video, and social media platforms, along with cloud services. Webscale network operators (WNOs) may also own access networks, typically using fiber, microwave or mmWave, and even fixed satellite. WNOs exploring outer space for providing connectivity include Amazon, Apple, Alphabet, Facebook, and Microsoft.
A broad set of vendors are benefiting from WNO capex spending – from semiconductor players selling into the data center market (Intel, AMD, Nvidia, Broadcom, etc), to optical components & transport vendors selling into data center interconnect markets (e.g. Infinera, II-VI, Lumentum/Neophotonics), to contract manufacturers of white box/OCP servers (e.g. Wistron and Quanta). Cisco, for instance, recorded approximately $4.0B in 2021 sales to the webscale sector, up from about $2.1B in 2020. The construction industry also sees webscale as important, as much of their capex is for development of data center properties.
Network investment outlook
Our current forecast calls for $187B of webscale capex in 2022, and further growth in the out-years until capex hits about $252B in 2026. For now, we are maintaining these targets. Despite a modest slippage in profitability, cash/debt and top-line growth in 4Q21, the sector retains many strengths which won’t go away overnight. Cloud services revenue growth remains strong, as does profitability for most players. Moreover, 2022 capex guidance from the major webscalers suggests modest growth; a summary follows:
- Amazon: 4Q21 earnings call confirmed that network/IT (“infrastructure” for AWS) is about 40% of total, consistent with MTN Consulting assumptions. Other components are fulfillment/logistics and transportation. For future capex, it says “we’re still working through some of our plans for 2022, but it’s coming into focus a bit. We see the CapEx for infrastructure going up…we’re adding regions and capacity to handle usage that still exceeds revenue growth in that business. So we feel good about making those investments.”
- Facebook (Meta): still calling for 2022 capex, including principal payments on finance leases, in the range of $29-34 billion (2021 actual: $19.2 billion). Says capex is driven by investments in data centers, servers, network infrastructure, and office facilities, and next year’s figure “reflects a significant increase in our AI and Machine Learning investments, which will support a number of areas across our Family of Apps.”
- Alphabet: projects a “meaningful increase in CapEx” for 2022, due to both technical infrastructure (mainly servers) and office facilities, where the company says it is “reaccelerating investment in fit-outs and ground-up construction.”
- Microsoft: expects 1Q22 capex to decline sequentially versus 4Q21, a change from the prior year period when 1Q21’s total capex was up 22% versus 4Q20. Does not provide any longer-term guidance. Its pending acquisition of Activision Blizzard is likely a factor in future plans, for two reasons. First, the deal consumes a lot of cash, and second, absorbing Activision would likely come with some changes in data center strategy. Currently Activision does not have any of its own data centers, rather, it rents colocation space in third-party facilities. The combined company will clearly want to see benefits from Microsoft’s data center footprint.
- Oracle: expects capex to continue in the roughly $1B per quarter range through the end of its current fiscal year (May 2022).
- Tencent: no concrete guidance but has hinted at Facebook-like investments in the “metaverse,” says it has a lot of the building blocks needed, for example, “a lot of gaming experiences…very strong social networking experience…engine capability, we have AI capability, we have the capability to build a large server architecture that can serve a huge number of concurrent users. We are very experienced in managing digital content economies as well as real-life digital assets.”
- Apple: nothing concrete on capex specifically, but in April 2021 it announced “$430 billion in contributions to the US economy include direct spend with American suppliers, data center investments, capital expenditures in the US, and other domestic spend…”
- Alibaba: no concrete guidance but 4Q21 call said it will continue to “invest in expanding its international infrastructure,” saying it now provides cloud services in 25 regions globally and that it is “committed to serving the real economy for the long term and the digitalization of all industries”. At its Apsara conference in October 2021, the company unveiled several new proprietary products, including Yitian 710 server chip, the X-Dragon architecture, Panjiu cloud-native server series, Alibaba AI and big data platform and a new generation of PolarDB database. It has global aspirations for its IaaS and PaaS services.
- Baidu: hasn’t addressed capex recently but on 4Q21 earnings call cited strong cloud demand growth, and said it is “trying to retain rapid revenue growth for 2022 and beyond,” which will require infrastructure investments.
- Twitter: its capex appears to be moderating now that it has (largely) completed construction of its new data center.
While we are maintaining the forecast outlook as published in Dec 2021, Amazon is a wildcard. It provides no specific guidance, and is clearly the market leader. Its quarterly outlays will be watched carefully. Even if its total capex does moderate, it is possible that the network/IT % of total will rise.
Implications for carrier-neutral market segment
Webscalers with cloud operations are building out their data center footprints, and most webscalers are deploying more complex functionality into their networks (video, gaming, AI, metaverse). However, webscalers do have some financial pressures, and more important have an increasingly rich range of options for how they expand. The carrier-neutral segment (CNNO) of data center players is investing heavily in larger, more hyperscale-friendly and energy efficient facilities. Further, the sector is consolidating with help from private equity. MTN Consulting expects webscalers to continue to lean heavily on these third-parties for expansion in 2022 and beyond. As a result, data center CNNOs like Digital Realty, Equinix and its JV partners, QTS/Blackstone, CyrusOne/KKR/GIP, American Tower/CoreSite, and GDS will become more attractive to vendors as they invest more in network technology of their own.
- Table Of Contents
- Figures & Charts
- Coverage
- Visuals
Table Of Contents
- Abstract
- Analysis
- WNO Market: Key Stats
- Company Drilldown
- Top 8 WNOs
- Company Benchmarking
- Regional Breakouts
- Raw Data
- Exchange Rates
- About
Figures & Charts
- Key Metrics: Growth rates, Annualized 4Q21/4Q20 vs. 2011-21
- WNO Revenues: Single-quarter & annualized (US$M)
- Top 8 WNOs: YoY revenue growth in 4Q21
- Annualized profitability: WNOs
- Free cash flow per employee, 4Q21 annualized (US$)
- FCF Margins vs. Net Margins, 4Q21 annualized
- Advertising revenues as % total (FY2021)
- Annualized capex and R&D spending: WNOs (% revenues)
- WNO capex by type, Annualized: 4Q15-4Q21 (US$M)
- Network & IT capex as share of revenues, 4Q21 annualized
- R&D expenses as % revenues, Top 8 WNOs (4Q21 annualized)
- Acquisition spending vs. capex spending, 4Q15-4Q21 annualized (US$M)
- Net PP&E per employee (US$’ 000) – 4Q21
- Ranking the Webscale Network Operators: Revenues; R&D; Capex; Network & IT capex – 2021 & 4Q21 (US$B)
- Revenues: annual, single-quarter, and annualized (US$M)
- Profitability (Net Profit; Cash from operations; Free cash flow): annual, single-quarter, and annualized (US$M)
- Spending (R&D; M&A; Capex; Network & IT capex; Lease): annual, single-quarter, and annualized (US$M)
- Cash & Short-term Investments: annual and single-quarter (US$M)
- Debt (Total debt; Net debt): annual and single-quarter (US$M)
- Property, Plant & Equipment: annual and single-quarter (US$M)
- Key Ratios: Net margin; R&D/revenues; Capex/revenues; Network & IT capex/revenues; Free cash flow/revenues; Lease costs/revenues – annual and annualized (%)
- Total employees
- Revenue per employee, annualized (US$K)
- FCF per employee, annualized (US$K)
- Net PP&E per employee, annualized (US$K)
- Revenues & Spending (US$M)
- Webscale Business Mix by Revenues (FY2021) – MTN Consulting estimates
- Top 10 recent acquisitions & investments
- Revenues (US$M) & YoY revenue growth (%), single-quarter: by company
- Revenues, annualized (US$M): by company
- Annualized profitability margins: by company
- Annualized capex and capital intensity: by company
- Annualized capex and R&D spending as % of revenues: by company
- Share of WNO network & IT capex, Annualized: by company
- Total employees: by company
- Annualized per-employee metrics (US$000s): by company
- Net debt (debt minus cash & stock) (US$M): by company
- 2011 vs. 2021: company benchmark by KPI (Revenues, R&D, Net profit, Cash from operations, Capex, Free cash flow, Cash & short-term investments, Net PP&E, Total debt)
- 2011 vs. 2021: company benchmark by key ratio (Capex/revenues; R&D/revenues; Net margin; FCF margin)
- Top 8 WNO’s share vs. Rest of the market: by KPI (Revenues, R&D, Net profit, Cash from operations, Capex, Free cash flow, Cash & short-term investments, Net PP&E, Total debt)
- Top 8 WNOs benchmarking by Key ratio: Capex/revenues; R&D/revenues; Net margin; FCF margin)
- Total WNO Market Revenues, by region: Latest CY; Latest Quarter; Annual trend (2011-20); Single quarter (4Q14-4Q21)
- Regional revenues by operator: Latest CY; Latest Quarter; Annual trend (2011-20); Single quarter (4Q14-4Q21)
- Top 10 operators by region: Latest CY; Latest Quarter
Coverage
| Top 8 WNOs | |||
| Alibaba | Alphabet | Amazon | Apple |
| Baidu | Microsoft | Tencent | |
| Other WNOs | |||
| Altaba | ChinaCache | Cognizant | eBay |
| Fujitsu | HPE | IBM | JD.com |
| Oracle | SAP | ||
| Yandex | |||
Visuals