By Arun Menon and Matt Walker
MTN Consulting’s Telco Opex Analyzer analyzes the opex trends of a subset of key telcos in the telecommunications sector. The report’s dashboard allows a user to dig into overall spending levels, network’s contribution to opex, network-related capex, and profitability for a group of 30 individual operators. The report is designed to help vendors understand and plan for the needs of their customers and help network operators deploy their technology budgets wisely. The report’s format is Excel.
ABSTRACT
The telecom sector posted 5.3% YoY growth in revenues in 2021 – the fastest growth rate experienced in a decade. However, much of this growth was due to a pandemic-induced low base period, non-service revenues, and exchange rate fluctuations. Historically, telcos have faced flat revenues and after adjusting for exchange rate fluctuations and COVID-19, top-line growth has been in the range of 1-3% per year, for many years. In contrast, their counterparts in the webscale sector have been witnessing double digit growth rates. As a result, telcos have been focused on their cost base in search of profitability growth. Costs include both capital expenditures (capex) and operating expenses (opex). Many MTN Consulting reports analyze capex. That’s in line with the traditional focus of most vendors, who historically sell more into capex budgets than opex. Opex is rising in importance to vendors, though, and as a cost category it is several times the size of capex. Further, understanding and effectively managing opex is crucial for telcos seeking success. Telco earnings reports make this obvious, as they highlight things like opex transformation programs, careful opex management, cost optimization initiatives, network efficiencies, and process automation.
This report aims to help understand opex trends in the telco market. This is an expansion of our first opex study, which was published in late 2021. This new edition has expanded the sample telco group coverage from 21 to 30 companies, and added a year of data coverage (2021). This new edition is now based on sample of telcos which more closely mirrors the globe. The regional splits for the sample telco group of 30 companies is spread across major regions with Asia representing 41.6% (of 2021 revenue total by HQ region), Americas 26%, Europe 22.5%, and MEA at 9.9%.
Solving the opex conundrum
Managing opex is extremely important for telco CxOs. The problem is that opex is a bit of a mystery – it’s hard to understand across companies, countries, and over time. Reporting categories, definitions, and accounting standards vary widely. This report solves the problem. We have created a taxonomy of opex categories, examined a broad cross-section of telcos, and calculated a detailed opex profile for both the individual companies and the overall telecommunications industry.
Key findings below:
(1) For telcos, the network is their factory. The sum total of all network-related opex – including network operations (netops), netinfra (leasing, interconnection, and spectrum fees), utilities (90% of which is assumed to be network-related), and depreciation (85%) – accounts for a staggering half (49.7%) of total opex, on average. For a few telcos, the network-related opex share can even shoot up to 70% (Du, Ooredoo) or 80% (Airtel).
(2) Costs related to maintaining the network are one of the key opex elements for telcos. On average, network operations opex alone accounted for close to a fifth (17.0%) of total opex for telcos in the 2016-21 timeframe. This ratio has been rising over the years, and upwards pressure is likely to continue. Further, network operations opex can vary noticeably across companies – 10 telcos spent over 20% of total opex on netops in our study, while at least one telco (Telkom Indonesia) spent over 30%.
(3) On the contrary, netinfra opex has been declining, particularly since 2019 due to implementation of a new accounting standard (IFRS 16) that impacts the treatment of operating lease costs. However, an increase in depreciation and amortization expenses has offset this decline.
(4) Utilities, content, and R&D opex average to 3.7%, 8.2%, and 0.8% of total opex, with lots of variation around these averages: Airtel spends about 12% of opex on utilities, content accounts for over 35% of total opex for Comcast, and BT is a big spender on innovation with R&D accounting for over 4.2% of total opex.
(5) Cost of devices, including both mobile and fixed CPE, averages to over 10% of total opex but surpasses 20% for some operators, mostly mobile-focused companies. Disentangling the revenues recorded from these devices from their costs, in order to calculate loss or gain, is nearly impossible due to telco reporting practices.
(6) Sales & Marketing (including non-network customer support) and G&A averaged to 14.3% and 12.3% of total opex, respectively, for 2016-21. The sales & marketing category, though, exceeds 20% of total opex for a few telcos. SK Telecom, for instance, spent a whopping 36.6% of total opex on sales & marketing in 2021 – South Korea is especially witnessing cash-burning marketing campaigns by telcos to provide subsidies for mobile phone purchases. In contrast, G&A has less variation, but can also exceed 20%; one factor is the degree to which companies rely on third-parties for core corporate functions, as well as the cost of insurance, HQ facilities, non-income taxes, regulatory fees, and other factors.
(7) Depreciation and amortization (D&A), while a non-cash expense, is the single largest opex category, amounting to an average of 22.5% of total opex across 2016-21 for the group of 30 telcos. This 22.5% is consistent with the global telco market, where D&A accounted for 21.3% of total opex in the same timeframe. D&A costs as a percent of opex for the group of 30 telcos grew from 21.7% in 2018 to 23.2% in 2021, due mainly to IFRS 16 implementation. The same trend is reflected in the global telco market which increased from 20.3% in 2018 to 22.4% in 2021.
(8) Labor costs are a significant contributor to a telcos’ total opex (>18%), and they stretch across multiple categories of spending: network operations, sales & marketing, and G&A. For the group of 30 telcos, labor costs per employee have been rising, which mimics the global telco market trend. Labor costs per employee for the group of 30 rose from $47K in 2016 to $58.9K in 2021, vs. $48K in 2016 to $58K for the global telco market. Telcos are reshaping their workforces right now, cutting headcount, retraining existing employees, and hiring new ones with skills more attuned to the “software is eating the world” era. Variations in the average cost of an employee are one important factor in gauging the pace of automation within a telco.
Implications
Many of the above results will not be surprising to those who track telcos closely. However, putting a credible number on a “gut feel” is a leap forward from the status quo. Vendors need to be able to position themselves effectively to customers. Telcos and analysts tracking them need to have an apples to apples comparison of how their costs compare to peers.
As far as public reporting goes, this study alone may not impact telcos’ opacity and inconsistency around opex. These practices have historic roots, in some cases, and old habits can be hard to break. But observers should recognize that the practices are often self-serving, and just because a company says an initiative saved money, doesn’t mean it really did. Company execs in every industry tend to dress up their financial results to look as attractive as possible, and telecom is no different.
Next steps in our research
This study is based on a deep dive into the financials of 30 significant telcos*: their size, region, business model, cost structure and other factors vary, allowing us to generalize based on their results. However, we will be expanding the size of the sample in the first-half of 2023, and also updating the timeframe to include 2022 results.
___
*Companies included: Advanced Info Service (AIS), Airtel, Batelco, BT, Charter Communications, China Mobile, Chunghwa Telecom, Comcast, Du, Etisalat, Globe Telecom, KDDI, KPN, Megafon, MTN Group, Oi, Ooredoo, Orange, Proximus, Saudi Telecom (STC), Singtel, SK Telecom, Starhub, Swisscom, Telecom Argentina, Telecom Italia, Telkom Indonesia, Telus, Turk Telekom, and Veon.
- Table Of Contents
- Figure & Charts
- Coverage
- Visuals
Table Of Contents
- Abstract
- Results for Group of 30 Telcos
- Results by Company
- Taxonomy
- About
Figure & Charts
- Capex and Opex as % of Revenues – Group of 30
- Network-related capex and opex in 2016-21: Group of 30 (% revenues)
- Opex by category, 2016-21 average
- Network-related opex categories as % of total opex, 2016-21
- All network-related opex, % total
- Profit margins for group of 30 telcos, 2016-21 average
- Labor costs as a % of total opex
- Labor costs per employee (US$K)
- Opex items by company, % total opex: 2021
- Profitability margins by company, 2021
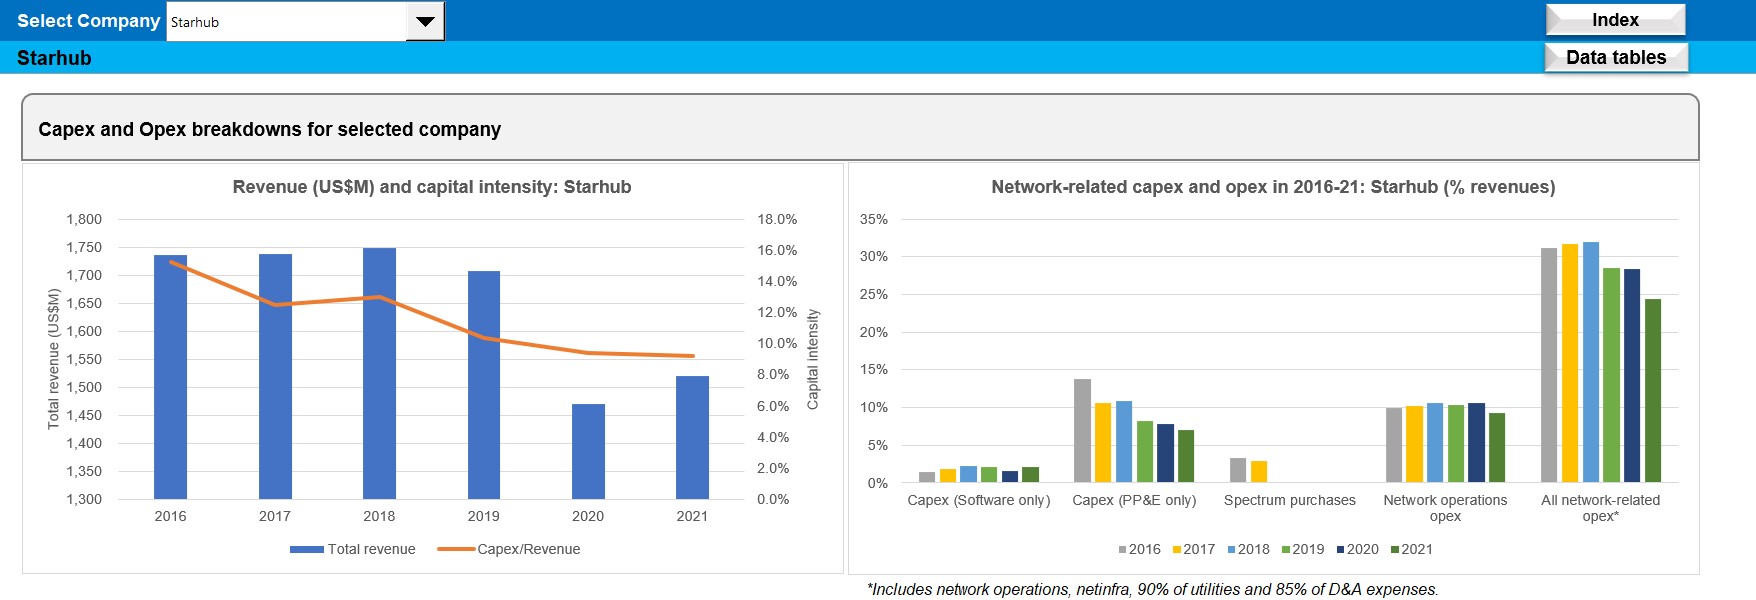
- Company-level revenue (US$M) and capital intensity
- Company-level network-related capex and opex in 2016-21
- Company-level opex by category, 2016-21 average
- Company-level network-related opex categories, as % of total opex, 2016-21
- Company-level all network-related opex as % of total opex
- Labor costs per employee (US$K): company vs. global telco average
- Labor costs as a % of total opex: company vs. global telco average
- Average profit margins, 2016-21: company vs. global telco average
- Company-level profitability trends, 2016-21
Coverage
Operator coverage:
| Advanced Info Service (AIS) |
| Airtel |
| Batelco |
| BT |
| Charter Communications |
| China Mobile |
| Chunghwa Telecom |
| Comcast |
| Du |
| Etisalat |
| Globe Telecom |
| KDDI |
| KPN |
| Megafon |
| MTN Group |
| Oi |
| Ooredoo |
| Orange |
| Proximus |
| Saudi Telecom (STC) |
| Singtel |
| SK Telecom |
| Starhub |
| Swisscom |
| Telecom Argentina |
| Telecom Italia |
| Telkom Indonesia |
| Telus |
| Turk Telekom |
| Veon |
Visuals