By Matt Walker
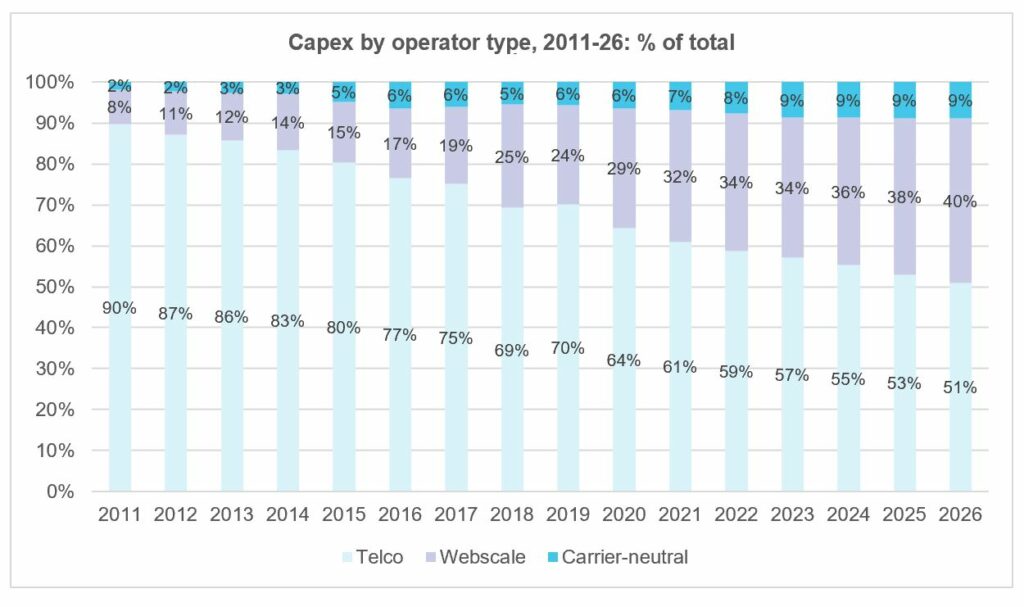
Global economies have recovered from the worst of last year’s pandemic, but COVID-19 has caused some long-term shifts in market dynamics. Network traffic growth rates have accelerated, new business models emerged, cloud services matured and spread to new verticals, applications and customer sizes. Networks are more important than ever. Revenue growth rates and profitability in all three segments that we track – telco, webscale, and carrier-neutral – have been stronger in recent quarters than anticipated. Network investments have grown, at sometimes stunning rates. Total network operator capex, across the three segments, is likely to total US$520 billion (B) in 2021, up 13.4% from 2020. Much of this year’s growth came from webscale, which will end 2021 at about 32.1% of total capex, from 29.3% in 2020. But telco and carrier-neutral capex have also spiked.
Looking ahead to 2026, capex growth rates will slow considerably but total capex is likely to reach $629B by 2026. In that year, telco, webscale, and carrier-neutral segments will account for roughly 51%, 40%, and 9% of capex, respectively. Networks will increasingly revolve around data centers, which will continue to proliferate both at the core and edge. Data center innovation will continue to be rapid, as webscalers push the envelope on network design and function, and telcos seek cheaper ways of running their networks. The telco need for cost efficiency will rise as overhyped 5G-based opportunities fail to materialize in any big way. Carrier-neutral operators (CNNOs) will remain important to telcos and webscalers, and benefit from an ongoing wave of new capital which will help them transform to more integrated providers of “digital infrastructure” assets.
Network operator interdependence
MTN Consulting’s Global Network Infrastructure (GNI) service tracks the economics of telcos, webscalers, and carrier-neutral operators. The three groups are not homogenous. Webscale revenue models revolve around a diverse mix of advertising, devices, software, cloud services, and ecommerce. Carrier-neutral providers rent network infrastructure to other businesses. Telcos sell subscription and pay-as-you-go services for communications services, including bandwidth, video, mobility, and enterprise services. There is a huge amount of variety in these discrete market segments. What’s more important, though, is that the three segments rely on each other in important ways. Carrier-neutral players get most of their revenues from telcos & webscalers needing to fill gaps in network coverage. Telcos rely on CNNOs to lower their cost of operations, and need webscalers to provide services and apps which make their network worth using beyond telephony. Webscalers lack last mile access networks, and can only deliver their services to the mass market over telco infrastructure. Webscalers also, despite big capex outlays, can only blanket the globe with data centers by partnering with CNNOs for collocation.
Looking ahead, this interdependence will grow. The big cloud providers in the webscale market, for instance, have targeted the telecom vertical and found success; AWS, Azure and GCP recorded about $2B in revenues from telcos over the last 4 quarters. Telcos are making some big bets on cloud technology as they deploy 5G core networks. Both telcos and webscalers want to provide seamless, resilient network coverage, including at the edge, and can’t build it all themselves. As a result, they’ll need to scale up their partnerships with carrier-neutral players like Equinix and American Tower/CoreSite. CNNOs are increasingly taking over the “dumb pipe” aspects of the network, and to be competitive and upsell they will integrate assets across fiber, cell tower and data center.
Telco revenues will grow just a bit; capital intensity to fall after 2023, towards 15% range
From an unusually weak 2020 base, telco revenues are likely to grow nearly 7% in 2021 to $1,912 billion, but growth thereafter will return to the more typical 1-3% range per year range. By 2026, telco revenues are likely to measure $2.1 trillion. Telco capex is also rising in 2021, up about 8% to $317B, and will hover around $330B for the next three years until falling to $320B by 2026. Drivers for investment in the near term include: expanding 5G RAN coverage; infrastructure for new 5G-based services; replacing Huawei gear; government subsidies of fiber deployment (US and Europe, mainly); 5G stand-alone core projects; transmission and IP-layer (e.g. intent-based routing) upgrades; network automation; and a broad range of software investments, including projects done in collaboration with webscalers (which do impact capex, thanks in part to flexible accounting rules). Software will rise from about 15% of capex last year to 20% by 2026. The main constraint on telco investment is limited prospects for top-line growth. Telcos will remain in a constant battle with their cost structure, seeking to deploy technologies which help lower cost per bit, lower energy costs, lower the cost of running networks. Telco collaborations with webscalers on service creation and delivery, and network offload, will also help on the cost side, as will reliance on CNNOs for key network assets.
Regionally, the strongest capex growth rates (from a 2020 base) will be seen in India and MEA. India has all of its 5G deployment ahead of it. MEA includes markets with very underdeveloped fixed network infrastructure, and increased data center & subsea investment underway should help spur this along.
The telecom industry will continue to shrink headcount, dropping employees from 5.09M in 2019, to 4.77M this year, and further to 4.44M by 2026. The average employee will cost more, though, as the skillsets required to build and run tomorrow’s networks are far different and also pricier. Telco labor cost per employee was US$53.1K in 2019, $54.5K in 2020, about $58K in 2021, and will rise further to $77K by 2026. As a result, the share of operating expenses (opex) (excluding depreciation & amortization) devoted to labor costs will also rise, up from 22% this year to 24% in 2026.
Webscale capex likely to pass $250B by 2026 as revenues approach $3.5 trillion
The webscale sector saw incredible growth rates in 2021 on the back of changes wrought by COVID: cloud services adoption, ecommerce spreading far and wide, and a strong digital ad market. Adoption of 5G devices has also helped one key webscaler, Apple. As a result, total webscale revenues exploded from $1.71T in 2020 to about $2.14T in 2021. Growth will slow but the sector will continue to leverage its scale and cash to push into new markets, with 2026 revenues likely to reach about $3.46T. Capex also spiked in 2021, likely to end the year at about $167B (2020: $134B), and will hit about $253B by 2026 even with significant slowdown in growth. About 45% of the 2026 capex budget will for Network, IT and software investments, from about 41% in 2021 when ecommerce-related investments were relatively important.
While webscalers have different business models, they all need massive data center-centric networks to support their operations. Webscalers continue to build out huge facilities at the core, across the globe, and also building out network edges to improve resiliency, latency and coverage. They’re also investing heavily in new technologies for their data centers, to economically support their growth and deliver new services and network functions. US-based webscalers have been doing this for many years, and Facebook announced a big new capex push for 2022 recently aimed at implementing more AI/ML capabilities in its facilities, to support “ranking and recommendations for experiences across” its products. Increasingly the Chinese players are getting in the self-design game. At Alibaba’s recent Apsara conference, for instance, the company unveiled several new proprietary products, including the Yitian 710 server chip, the X-Dragon architecture, the Panjiu cloud-native server series, Alibaba AI and big data platform and a new generation of PolarDB database.
Carrier-neutral the smallest market but plays key role, will grow capex share to 9% by 2026
As we discussed in a mid-2021 report, the carrier-neutral sector is currently seeing a transformation driven by the desire to integrate multiple types of assets under one roof. That includes companies acquiring across traditional asset boundaries, such as the recent American Tower-CoreSite acquisition, and the investments by private equity firms to invest across asset classes. There will be bumps in the road as a new breed of CNNOs emerge, but they are likely to play even more important roles in the network infrastructure market within 2-3 years. Their integrated offerings will prove attractive to both telcos and webscalers, for financial and operational reasons, and allow them to focus more on their core businesses.
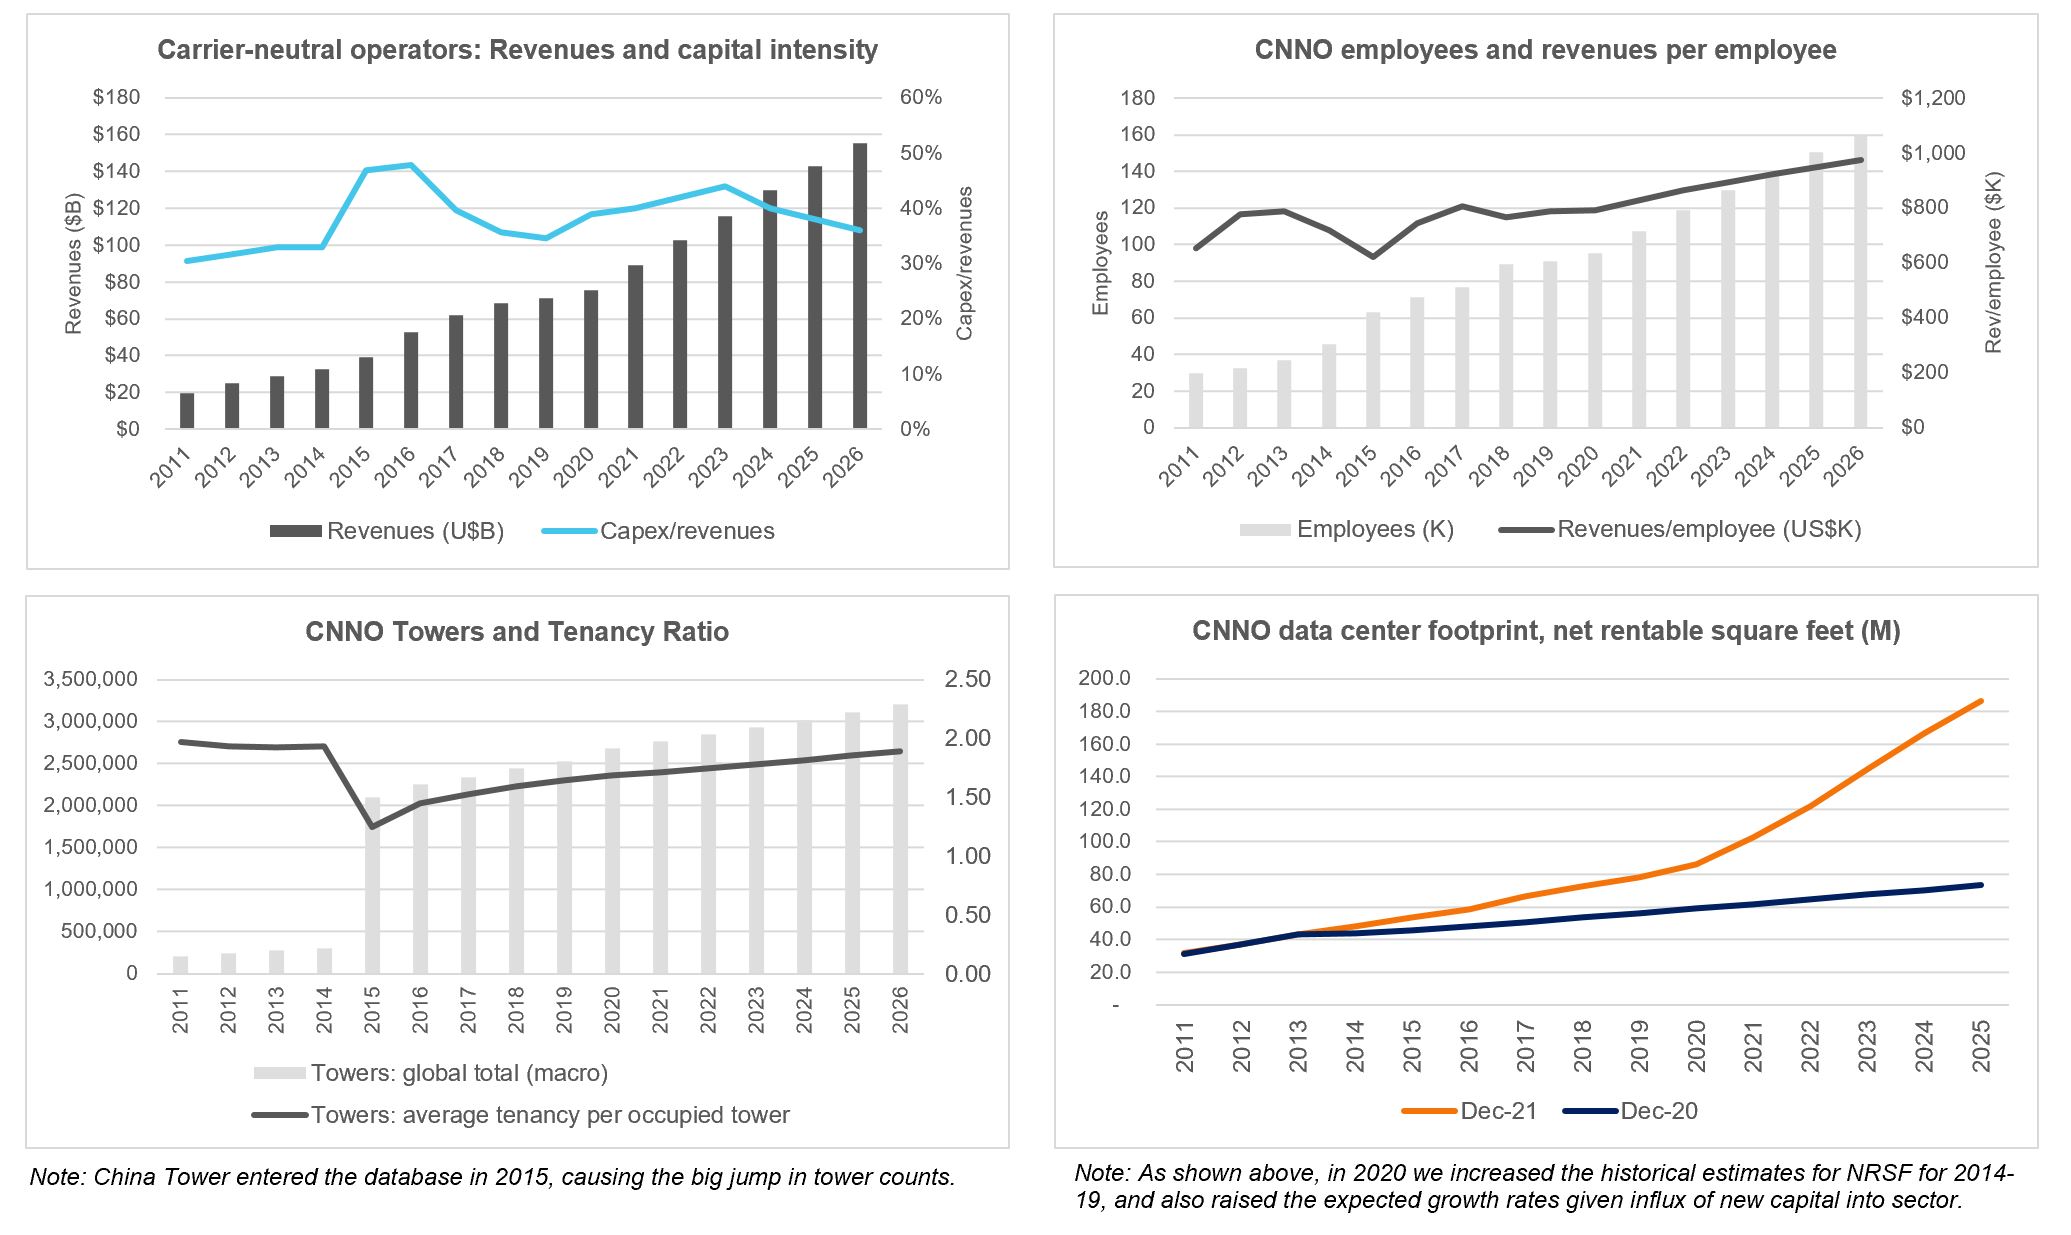
The CNNO segment is the smallest we cover, but its revenues will more than double between the 2020 base of $76 billion to reach roughly $155B by 2026. Their capex will come close to doubling, up from $29B in 2020 (6.4% of the combined telco/webscale/CNNO total) to about $56B in 2026 (8.9% of total). Much of the CNNOs’ capex is devoted to real estate and low-tech investments, but they will also invest significant sums on transport, IP, and other types of network infrastructure. Digital Realty, for instance, recently signed a data center interconnect deal with Ciena.
CNNOs’ power management strategies will also be key to helping the network operator market improve its carbon footprint. In fact, sustainability is a common investment theme cutting across all three types of network operators. Telcos are most important, as they have the oldest, most complex networks and also the biggest opportunity for improvement. Across the key segments, most key network operators publish sustainability reports and have stated targets for carbon neutrality and/or net zero status. In the past, energy cost savings was the key motivator. Increasingly, though, key executives across the network operator industry are addressing sustainability as a moral issue which requires urgent attention, and investment – these leaders should be applauded.
- Table Of Contents
- Figures & Charts
- Coverage
- Visuals
Table Of Contents
Key sections include:
- Abstract
- Telco Market Forecast
- Webscale Market Forecast
- Carrier-neutral Market Forecast
- About
Figures & Charts
FIGURES
Totals for all operators
Revenue by operator type, 2011-26 (US$B)
Capex by operator type, 2011-26 (US$B)
Capex by operator type, 2011-26: % of total
Capital intensity by operator type, 2011-26
Employees by operator type (M)
Revenues/employee by operator type (US$K)
Capex forecast by segment: Dec 2021 vs. Dec 2020 outlook, % difference
Capex forecast by segment: Dec 2021 vs. Dec 2020 outlook, $B difference
Telco forecast
Telcos: Revenues ($B) vs. capital intensity
Software capex in US$B and as % of total capex
Telco opex components, 2020 vs. 2026
Telcos: Capex and network operations opex ($B)
Telcos: Employees vs. average labor cost per employee ($K)
Telcos: Labor cost opex in US$B and as % of Opex ex-D&A
Telco margins, actual and predicted
Dec 2021 vs. Dec 2020 forecast: % changes in key metrics
Telco forecast by region
Revenues by region: 2014, 2020, and 2026 (US$B)
Capex by region: 2014, 2020, and 2026 (US$B)
Telcos: capital intensity by region
Capex by region, % global
Capex by region: Dec 2021 vs Dec 2020 Forecast
Average capital intensity, Dec 2021 vs. Dec 2020 forecast
Webscale forecast
Webscale revenues and capital intensity
Webscale capital intensity by company HQ
Webscale capex by company HQ (US$B)
Webscale capex by type (US$B)
Webscaler R&D as % of revenues by company HQ
Webscale revenue per employee ($K) by company HQ
Percent change in outlook, Dec 2021 vs. Dec 2020 forecast
Webscale capex by type: % change in forecast, 12/21 v. 12/20
Carrier-neutral forecast
Carrier-neutral operators: Revenues and capital intensity
CNNO employees and revenues per employee
CNNO Towers and Tenancy Ratio
CNNO data center footprint, net rentable square feet (M)
Percent difference in key metrics: Dec 2021 vs. Dec 2020 forecast
CNNO Capex ($B): Dec 2021 vs. Dec 2020 Forecast
Capital intensity: 2011-20 by segment and 2021-26 industry average
CNNO capex by segment, 2011-20 (US$B)
Coverage
This forecast report addresses three large segments of network operators, covering nearly 200 operators in total, specifically:
| Segment | Company name |
| Carrier-neutral | American Tower |
| Carrier-neutral | Arqiva |
| Carrier-neutral | Balitower |
| Carrier-neutral | Bharti Infratel |
| Carrier-neutral | Cellnex |
| Carrier-neutral | China Tower |
| Carrier-neutral | Chorus Limited |
| Carrier-neutral | Cogent |
| Carrier-neutral | CoreSite Realty |
| Carrier-neutral | Crown Castle |
| Carrier-neutral | CyrusOne |
| Carrier-neutral | Digital Realty |
| Carrier-neutral | DuPont Fabros |
| Carrier-neutral | EI Towers |
| Carrier-neutral | Equinix |
| Carrier-neutral | GDS Data Centers |
| Carrier-neutral | GTL Infrastructure |
| Carrier-neutral | GTT Communications |
| Carrier-neutral | Internap |
| Carrier-neutral | Interxion |
| Carrier-neutral | Inti Bangun Sejahtera |
| Carrier-neutral | Inwit |
| Carrier-neutral | Level 3 |
| Carrier-neutral | Lumos |
| Carrier-neutral | NBN Australia |
| Carrier-neutral | QTS Realty |
| Carrier-neutral | Sarana Menara Nusantara |
| Carrier-neutral | SBA Communications |
| Carrier-neutral | Solusi Tunas Pratama |
| Carrier-neutral | Superloop |
| Carrier-neutral | Switch |
| Carrier-neutral | TDF Infrastructure/Arcus |
| Carrier-neutral | Telesites |
| Carrier-neutral | Telxius/Telefonica |
| Carrier-neutral | Tower Bersama Infrastructure |
| Carrier-neutral | Uniti Group |
| Carrier-neutral | Zayo |
| Telco | A1 Telekom Austria |
| Telco | Advanced Info Service (AIS) |
| Telco | Airtel |
| Telco | Altice Europe |
| Telco | Altice USA |
| Telco | America Movil |
| Telco | AT&T |
| Telco | Axiata |
| Telco | Axtel |
| Telco | Batelco |
| Telco | BCE |
| Telco | Bezeq Israel |
| Telco | Bouygues Telecom |
| Telco | BSNL |
| Telco | BT |
| Telco | Cable ONE, Inc. |
| Telco | Cablevision |
| Telco | Cell C |
| Telco | Cellcom Israel |
| Telco | CenturyLink |
| Telco | Cequel Communications |
| Telco | Charter Communications |
| Telco | China Broadcasting Network |
| Telco | China Mobile |
| Telco | China Telecom |
| Telco | China Unicom |
| Telco | Chunghwa Telecom |
| Telco | Cincinatti Bell |
| Telco | CK Hutchison |
| Telco | Clearwire |
| Telco | Cogeco |
| Telco | Com Hem Holding AB |
| Telco | Comcast |
| Telco | Consolidated Communications |
| Telco | Cyfrowy Polsat |
| Telco | DEN Networks Limited |
| Telco | Deutsche Telekom |
| Telco | Digi Communications |
| Telco | DirecTV |
| Telco | Dish Network |
| Telco | Dish TV India Limited |
| Telco | DNA Ltd. |
| Telco | Du |
| Telco | EE |
| Telco | Elisa |
| Telco | Entel |
| Telco | Etisalat |
| Telco | Fairpoint Communications |
| Telco | Far EasTone Telecommunications Co., Ltd. |
| Telco | Frontier Communications |
| Telco | Globe Telecom |
| Telco | Grupo Clarin |
| Telco | Grupo Televisa |
| Telco | Hathway Cable & Datacom Limited |
| Telco | Idea Cellular Limited |
| Telco | Iliad SA |
| Telco | KDDI |
| Telco | KPN |
| Telco | KT |
| Telco | Leap Wireless |
| Telco | LG Uplus |
| Telco | Liberty Global |
| Telco | M1 |
| Telco | Manitoba Telecom Services |
| Telco | Maroc Telecom |
| Telco | Maxis Berhad |
| Telco | Megafon |
| Telco | MetroPCS Communications |
| Telco | Millicom |
| Telco | Mobile Telesystems |
| Telco | MTN Group |
| Telco | MTNL |
| Telco | NTT |
| Telco | Oi |
| Telco | Omantel |
| Telco | Ono |
| Telco | Ooredoo |
| Telco | Orange |
| Telco | PCCW |
| Telco | PLDT |
| Telco | Proximus |
| Telco | Quebecor Telecommunications |
| Telco | Rakuten |
| Telco | Reliance Communications Limited |
| Telco | Reliance Jio |
| Telco | Rogers |
| Telco | Rostelecom |
| Telco | Safaricom Limited |
| Telco | Sasktel |
| Telco | Shaw |
| Telco | Singtel |
| Telco | SITI Networks Limited |
| Telco | SK Telecom |
| Telco | Sky plc |
| Telco | SmarTone |
| Telco | SoftBank |
| Telco | Spark New Zealand Limited |
| Telco | Sprint |
| Telco | StarHub |
| Telco | STC (Saudi Telecom) |
| Telco | SureWest Communications |
| Telco | Swisscom |
| Telco | Taiwan Mobile |
| Telco | Tata Communications |
| Telco | Tata Teleservices |
| Telco | TDC |
| Telco | TDS |
| Telco | Tele2 AB |
| Telco | Telecom Argentina |
| Telco | Telecom Egypt |
| Telco | Telecom Italia |
| Telco | Telefonica |
| Telco | Telekom Malaysia Berhad |
| Telco | Telenor |
| Telco | Telia |
| Telco | Telkom Indonesia |
| Telco | Telkom SA |
| Telco | Telstra |
| Telco | Telus |
| Telco | Thaicom |
| Telco | Time Warner |
| Telco | Time Warner Cable |
| Telco | TPG Telecom Limited |
| Telco | True Corp |
| Telco | Turk Telekom |
| Telco | Turkcell |
| Telco | Veon |
| Telco | Verizon |
| Telco | Virgin Media |
| Telco | Vivendi |
| Telco | Vodafone |
| Telco | Vodafone Idea Limited |
| Telco | VodafoneZiggo |
| Telco | Wind Tre |
| Telco | Windstream |
| Telco | Zain |
| Telco | Zain KSA |
| Telco | Ziggo |
| Webscaler | Alibaba |
| Webscaler | Alphabet |
| Webscaler | Altaba |
| Webscaler | Amazon |
| Webscaler | Apple |
| Webscaler | Baidu |
| Webscaler | ChinaCache |
| Webscaler | Cognizant |
| Webscaler | eBay |
| Webscaler | |
| Webscaler | Fujitsu |
| Webscaler | HPE |
| Webscaler | IBM |
| Webscaler | JD.COM |
| Webscaler | |
| Webscaler | Microsoft |
| Webscaler | Oracle |
| Webscaler | SAP |
| Webscaler | Tencent |
| Webscaler | |
| Webscaler | Yandex |
Visuals