By Matt Walker
This report reviews the growth and development of the webscale network operator (WNO) market. In 2022, webscalers represented $2.23 trillion (T) in revenues (+4% YoY), $268 billion (B) in R&D spending (+23% YoY), and $203B in capex (+14% YoY). They had $618B of cash and short-term investments (-17% YoY) on the books as of December 2022. Webscalers employed approximately 4.11 million (M) people in December 2022, from 4.09M in December 2021 and 3.61M in December 2020.
Webscale market hits speed bump in 2022 after unsustainably strong 2021
The webscale market of big tech players has grown rapidly in the last decade. Revenues grew from $640B in 2011 to $1,454B in 2019, just before COVID, for an average growth rate (CAGR) of about 11%. Revenues then grew by 18% and 25% in 2020 and 2021 respectively, as webscale business models benefited from the dislocations in economic activity created by COVID. This growth was unsustainable. In 2022, webscale revenues grew just 4% YoY, to $2,234B. By quarter, the last three months of 2022 were the worst for the market: revenues were flat YoY globally, at about $621B, after growing 9%, 4%, and 6% YoY in the year’s first three quarters.
Growth was slowed down by a confluence of factors. One was simply the post-COVID recovery: in 2022, people went back to work and school, and physical transactions often beat out online ones. Another was China’s ongoing, though unsteady, crackdown on the power of its own big tech players. Macroeconomic weakness was another: high inflation and rising interest rates enticed some webscalers to take the foot off the gas of growth. The fact that most big webscalers rely on ads for the bulk of their revenues have made the macro issues tougher to deal with. Finally, another factor is the slow development of 5G-based services and apps. Webscalers benefited enormously from the rollout of 4G and the behaviour changes enabled by 4G. With 5G, though, most early users are signing up to do more of the same thing with their devices, just a bit faster. It’s true that webscalers have invested heavily in new technologies which can benefit from 5G, such as autonomous vehicles, robotics, smart factories, and health care delivery, but most of these new ventures are on a slow growth trajectory.
In the first few weeks of 2023, the world has gotten a glimpse of something potentially revolutionary, which could boost webscalers: OpenAI’s ChatGPT platform. While this one is backed by Microsoft, several other webscalers have their own offering in this area (Google’s Bard, Baidu’s ERNIE, etc.). These AI platforms are about more than search; they also assist in content creation, data organization, and other areas. They have the potential to impact labor markets significantly. It’s hard to know how fast these will develop or what the mass market will ultimately use them for. But they are wildcards in the webscale market, and could contribute to the sector’s growth over the next few years.
Regionally the Americas were strongest in 2022, due in part to strong US dollar
Revenues in the Americas region, dominated by the US, saw the best growth in 2022: up 9% YoY to $1,019B, and representing 46% of the global market. Asia-Pacific, MEA, and Europe were all basically flat YoY (1-2% growth each). A weak Chinese market pulled down Asia revenues: Alibaba, Tencent and Baidu all experienced YoY revenue decline in 2022. Appreciation of the US dollar was a slight factor in Asia, as the Chinese Yuan fell 4% YoY in 2022 and the Japanese Yen dropped a dramatic 20%. Also significant was the Euro’s 12% YoY drop in 2022, which impacted many companies. For 4Q22 alone, the Americas performed best, up 5% YoY in revenues, while Asia, MEA, and Europe fell 4%, 3%, and 3% respectively.
Webscaler strength differs by region. In the Americas and Europe, Amazon, Apple and Alphabet are the top 3 for 2022. In MEA, it’s the same three but in a different order: Apple, Alphabet and Amazon. In Asia, the big Chinese ecommerce players shine, and the top 3 overall are JD.Com, Apple, and Alibaba. JD.Com has not yet attacked the cloud market as aggressively as other Chinese webscalers, but in 2022 JD Cloud became more visible and the company claims to be participating in the government’s “east-to-west computing resource transfer project.”
Webscale tech spending surged in 2022 despite topline moderation
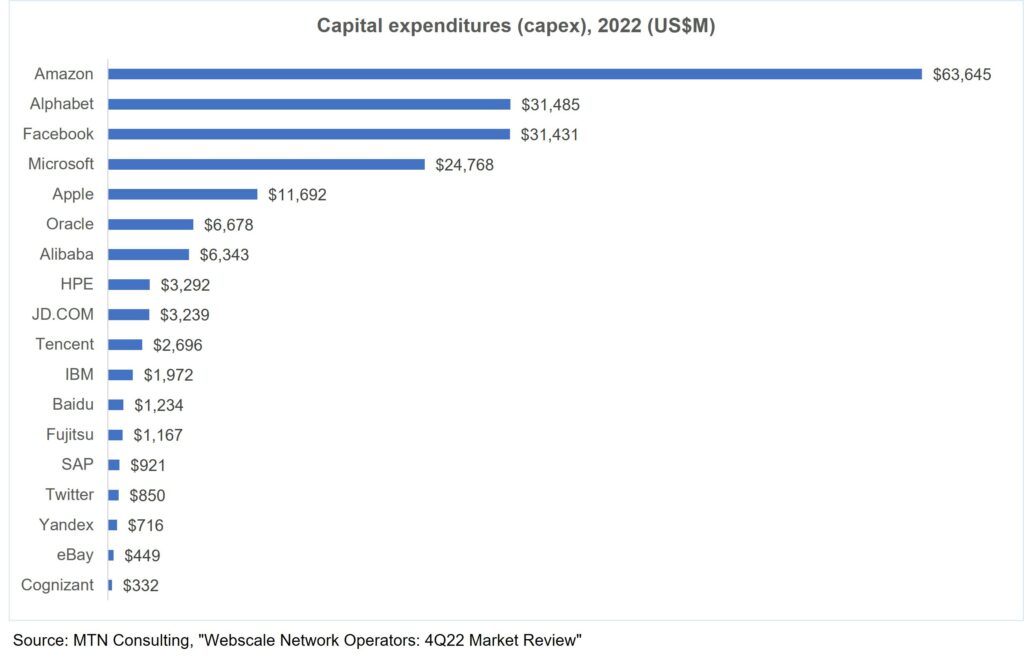
Webscale capex had another stellar year in 2022, up 14% to $203 billion. Strong capex growth means the sector’s capital intensity (capex/revenue) ratio grew in 2022, from 8.3% in 2021 to 9.1% in 2022. This is the highest it has ever been. Webscalers spent heavily on capex in 2018, but even then annualized capital intensity’s peak was 8.8% (in 4Q22). Across the top webscalers, capex has surged due to new data centers, supporting cloud services and new network functions. Smaller webscalers struggle to keep up, now relying more on third party data centers and migrating to capex-light strategies. That’s especially true for IT services focused companies like Cognizant, Fujitsu, HPE, IBM, and SAP; they are fading away in importance. By company, Amazon was by far the biggest spender in 2022, accounting for 31% of capex (2021: 34%), followed by Alphabet at 16% (2021: 14%), Meta/Facebook at 16% (10%), Microsoft at 12% (13%), and Apple at 6% (unchanged). Oracle’s share of sector capex nearly doubled in 2022, to 3.3%, from 1.8% in 2021, as it continues its cloud buildout; it is now ranked 6 in capex share.
Along with capex, spending on R&D also spiked in 2022, growing 23% from 2021 to hit $268 billion. R&D spend as a percentage of revenues was 12% in 2022, also a record high. Prior to 2022, the highest R&D/revenue ratio recorded came in 1Q20, when it hit 10.9%. Within the Top 8 group, Meta/FB spends by far the most on R&D, at 30% of revenues in 2022; the only one close was Baidu, at 19%.
Profitability slipping
The webscale sector’s profitability and overall financial strength weakened in 2022. Free cash flow as a percentage of revenues was 13.6%, from 16.1% in 2021 and around 19% the previous two years. Net profit margin fell below 14%, after averaging 18% over the previous 4 years. Total debt grew 6%, to $552 billion, while cash & equivalents fell 17%, to $618B. So, net debt for the sector is still negative, but less comfortably than in past years. By company, Microsoft, Apple, and Tencent had the best overall profit margins. As far as debt relative to cash, Alibaba, Alphabet, Baidu, JD.Com, Meta/FB, and Microsoft had the most comfortable debt to cash positions.
Layoffs hitting headcount
Given the sector’s record spending levels in 2022, amidst weakened profits, it’s not surprising that many webscalers are cutting back. In the last few months, several key webscalers have announced job cuts. Meta has attracted the most attention in this regard, laying off 13% of its workforce in December 2022, and another 13% announced in early March 2023. Meta is a bit of an outlier, as it announced an accelerated growth plan just as the market was about to turn negative, and it is dealing with a very effective competitor in ByteDance/TikTok. Most other webscalers continue to have safer market positions than Meta, but most are engaging in at least some workforce reductions. In January, Microsoft announced a 10,000 person reduction, or about 5% of its workforce, and Alphabet announced it would cut about 12,000 jobs or 6% of its workforce. Also in January, Amazon announced the elimination of 18,000 roles, about 1% of its workforce, and announced another 9K in cuts this month. To put these cutbacks in context, though, it’s worth recalling that the webscale sector grew headcount dramatically between 2019 and 2021, from 2.8 million to 4.1 million.
These layoffs were probably predictable, given recent trends. One metric we track in the webscale sector is free cash flow per employee. From 1Q11 through 3Q21 – more than a decade – this metric hovered in the $90-110K of free cash flow per employee range. Since then, profits failed to keep up with rapid hiring. The metric fell to $89.7K in 2021 and further south to $73.9K in 2022. If profits fail to recover in 2023, then we will see deeper cuts to the workforce.
Spending outlook
Prior to this latest round of webscaler earnings reports, MTN Consulting had already expected capex budgets to get tighter in 2023. MTN Consulting’s latest operator spending forecast called for $206B in 2022 capex, $211B in 2023, and $222B in 2024. For now, we will stick with this projection. The actual for 2022 was just $4B lower than projected.
Last year’s financial results for the industry were disappointing, but not catastrophic. Most key webscalers driving the market remain financially solid with strong market positions. Meta (Facebook) is an uncertainty, but it currently expects 2023 capex of $31-$34B, roughly flat with the blockbuster 2022 the company recorded. Chinese webscalers had a weak 2022 due to lockdowns and regulatory shifts, but should get back to growth in 2023. Alphabet is calling for “in line” capex in 2023, with an increase in the percentage spent on the network (“technical infrastructure”) versus office facilities. Amazon provides little guidance on the top line, so there is clearly downside risk here; however, it notes – like Alphabet – that the network will capture a larger share of capex in 2023 than last year. Microsoft does not provide guidance for CY23 due to its fiscal year, but does say it expects 1Q23 capex higher than 4Q22. Oracle, one key part of 2022’s growth, has said its capex will remain around the level of 4Q22 ($2.4B) for the next several quarters. This would push CY23 quite a bit higher than CY22 for Oracle. As always, these company projections are subject to updates as market conditions change. They can also change as webscalers reevaluate their level of reliance on third party data center owners.
Implications for carrier-neutral market segment
Webscalers with cloud operations are building out their data center footprints, and most webscalers are deploying more complex functionality into their networks (video, gaming, AI, metaverse). However, webscalers do have some financial pressures, and more important have an increasingly rich range of options for how they expand. The carrier-neutral segment (CNNO) of data center players is investing heavily in larger, more hyperscale-friendly and energy efficient facilities. Further, the sector is consolidating with help from private equity. MTN Consulting expects webscalers to continue to lean heavily on these third-parties for expansion in 2023 and beyond. As a result, data center CNNOs like Digital Realty, Equinix and its JV partners, QTS/Blackstone, CyrusOne/KKR/GIP, American Tower/CoreSite, and GDS will become more attractive to vendors as they invest more in network technology of their own.
One issue with more reliance on third-parties, though, is sustainability. As a whole, the carrier-neutral sector is behind the curve on investing in renewable energy resources. If webscalers want to make credible boasts about their environmental impact, they will need to present data on their overall usage of renewable energy, not just what’s used by their own data centers. Water consumption is another issue of importance in this area, and even harder to track.
- Table Of Contents
- Figures & Charts
- Coverage
- Visuals
Table Of Contents
- Abstract
- Analysis
- WNO Market: Key Stats
- Company Drilldown
- Top 8 WNOs
- Company Benchmarking
- Regional Breakouts
- Raw Data
- Exchange Rates
- About
Figures & Charts
- Key Metrics: Growth rates, Annualized 4Q22/4Q21 vs. 2011-22
- WNO Revenues: Single-quarter & annualized (US$M)
- Top 8 WNOs: YoY revenue growth in 4Q22
- Annualized profitability: WNOs
- Free cash flow per employee, 4Q22 annualized (US$)
- FCF Margins vs. Net Margins, 4Q22 annualized
- Advertising revenues as % total (FY2022)
- Annualized capex and R&D spending: WNOs (% revenues)
- WNO capex by type, Annualized: 4Q15-4Q22 (US$M)
- Network & IT capex as share of revenues, 4Q22 annualized
- R&D expenses as % revenues, Top 8 WNOs (4Q22 annualized)
- Acquisition spending vs. capex spending, annualized (US$M)
- Net PP&E per employee (US$’ 000) – 4Q22
- Ranking the Webscale Network Operators: Revenues; R&D; Capex; Network & IT capex – 2022 & 4Q22 (US$B)
- Annualized spending share for key webscalers since 2011 Capex: Network, IT and software
- Share of webscale spending by company, 4Q22 and 4Q21 annualized (Capex: Network, IT and software)
- Electricity consumption vs. Net PP&E for key webscalers in 2021
- Webscale vs. Telco Market: Annualized Capex (US$B)
- Webscale vs. Telco Market: Annualized capital intensity
- Revenues: annual, single-quarter, and annualized (US$M)
- Profitability (Net Profit; Cash from operations; Free cash flow): annual, single-quarter, and annualized (US$M)
- Spending (R&D; M&A; Capex; Network & IT capex; Lease): annual, single-quarter, and annualized (US$M)
- Cash & Short-term Investments: annual and single-quarter (US$M)
- Debt (Total debt; Net debt): annual and single-quarter (US$M)
- Property, Plant & Equipment: annual and single-quarter (US$M)
- Key Ratios: Net margin; R&D/revenues; Capex/revenues; Network & IT capex/revenues; Free cash flow/revenues; Lease costs/revenues – annual and annualized (%)
- Total employees
- Revenue per employee, annualized (US$K)
- FCF per employee, annualized (US$K)
- Net PP&E per employee, annualized (US$K)
- Revenues & Spending (US$M)
- Webscale Business Mix by Revenues (FY2022) – MTN Consulting estimates
- Top 10 recent acquisitions & investments
- Data center footprint
- Revenues (US$M) & YoY revenue growth (%), single-quarter: by company
- Revenues, annualized (US$M): by company
- Annualized profitability margins: by company
- Annualized capex and capital intensity: by company
- Annualized capex and R&D spending as % of revenues: by company
- Share of WNO network & IT capex, Annualized: by company
- Total employees: by company
- Annualized per-employee metrics (US$000s): by company
- Net debt (debt minus cash & stock) (US$M): by company
- 2011 vs. 2022: company benchmark by KPI (Revenues, R&D, Net profit, Cash from operations, Capex, Free cash flow, Cash & short-term investments, Net PP&E, Total debt)
- 2011 vs. 2022: company benchmark by key ratio (Capex/revenues; R&D/revenues; Net margin; FCF margin)
- Top 8 WNO’s share vs. Rest of the market: by KPI (Revenues, R&D, Net profit, Cash from operations, Capex, Free cash flow, Cash & short-term investments, Net PP&E, Total debt)
- Top 8 WNOs benchmarking by Key ratio: Capex/revenues; R&D/revenues; Net margin; FCF margin)
- Total WNO Market Revenues, by region: Latest CY; Latest Quarter; Annual trend (2011-22); Single quarter (4Q14-4Q22)
- WNO Market: Revenues, single-quarter (YoY % change)
- Regional revenues by operator: Latest CY; Latest Quarter; Annual trend (2011-20); Single quarter (4Q14-4Q22)
- Top 10 operators by region: Latest CY; Latest Quarter
Coverage
| Top 8 WNOs | |||
| Alibaba | Alphabet | Amazon | Apple |
| Baidu | Microsoft | Tencent | |
| Other WNOs | |||
| Altaba | ChinaCache | Cognizant | eBay |
| Fujitsu | HPE | IBM | JD.com |
| Oracle | SAP | ||
| Yandex | |||
Visuals