By Matt Walker
This forecast spreadsheet details MTN Consulting’s forecast for revenues, capex, headcount, and other metrics across three segments of network operators: telecom operators (telcos), webscale network operators (webscalers), and carrier-neutral operators (CNNOs). The spreadsheet provides 2011-21 actuals and projections through 2026, and includes projections from past forecasts for reference.
War and inflation worries emerge as COVID concerns fade
Our last network operator spending forecast was published in December 2021. Since then, COVID-19 worries have continued to dissipate. The severity of recent strains is much lower, vaccines have improved and vaccination rates have risen, travel has begun to normalize and business life has resumed in most countries. There are long-term effects from the pandemic. It gave a boost to online activities and enterprises, new businesses were created, and existing ones accelerated growth. It broadened awareness of public health issues. Virtual classes, meetings, and events are now more common, even when COVID is not a factor. Not all news was good, for sure, as the pandemic highlighted the nasty effects of online disinformation and how bad actors can use such things to create divisions in society. Hundreds of thousands, maybe millions, died needlessly due to avoidance of basic precautions like masks and washing your hands. Further, as COVID’s immediate worries have ebbed, most policymakers have been happy to revert to pre-pandemic thinking, rather than investing to prevent the next outbreak. But COVID is no longer a major factor depressing current global economic activity. China’s shutdowns have an impact, but are nothing like those of 1Q20.
While COVID fears have subsided, for now, there are other pressing issues impacting economic activity. Russia invaded Ukraine and is threatening a broader war. China showed a willingness to look the other way, and it continues to take expansionary steps in the South China Sea and beyond. Food and oil prices have risen dramatically, contributing to the worst inflation in decades, for many countries. Interest rates have risen in response, causing stock market valuations to drop. Higher interest rates also make it harder for companies to invest and borrow for growth, which hits network spending, a focus of this forecast. Moreover, semiconductor supply shortages persist, impacting the availability and price of all sorts of goods, including network equipment.
Macroeconomic changes are difficult to incorporate into forecasts of any kind. There is a high level of risk in this current climate. GDP forecasts published by official bodies like the European Commission and the IMF are moving targets, constantly subject to revision; forecasts released by investment banks and ratings agencies are also changing frequently. And these high-level macro forecasts generally don’t really consider geopolitical dislocations: what happens if Putin decides he wants Poland, too? What happens if Xi decides it’s time to force Taiwan into China’s fold? The bottom line is that forecasts, including this one, simply represent current expectations, and assume that nothing too dramatic happens to shift those expectations. All forecasts need to be interpreted with a grain of salt.
Network operator capex to reach $659B by 2026; telcos represent less than half of 2026 capex
This network operator forecast aggregates expectations for three network operator segments: telco, webscale, and carrier-neutral (CNNO). In 2021, these three markets accounted for $4.116 trillion of revenues (+14.9% YoY), $532 billion of capital expenditures (capex)(+15.4% YoY), and 8.91 million employees (+4.4% YoY). Over the last several years, the webscale market has grown rapidly, which accelerated during the COVID-19 pandemic as business shifted online. Webscale growth will drive the market going forward through 2026, as well. For the 2017-21 five-year period, webscale accounted for 26.4% of total capex, but that will rise to 37.2% of total over the next five years. Telcos will still account for the majority of total network operator capex, or 54.4% of capex over the next five years, but that’s down from 67.6% of total in the previous 5 years. For 2026 alone, telco capex will drop slightly below 50% of total. Meanwhile, CNNOs continue to rise in importance from a small base; their capex will rise from 5.8% of total in 2021 to about 8.7% of the 2026 market.
There are hundreds of network operators across the globe, of various types. We cover about 200, across the telco/webscale/CNNO market. A small number of very large players stand out. Focusing on capex over the last three years (2019-21), the largest 13 operators accounted for over 50% of the total; 5 of these are webscalers. The largest 50 operators captured over 80% of capex in the same time period; three of these are carrier-neutral providers (China Tower, Equinix, and Digital Realty), 10 are webscalers (Amazon, Alphabet, Microsoft, Facebook/Meta, Apple, Alibaba, Tencent, Oracle, IBM, and HPE), while the remaining 37 are telcos (from China Mobile, the largest of the group, to LG UPlus, the smallest of the top 50). These large operators not only make the most attractive customer targets for suppliers; they also have the most impact on technology development in networks, through their own R&D, participation in industry bodies, and work with (and purchasing from) vendors.
Network operator interdependence
The three groups of operators we track pursue a range of different business models, even within segments. Webscale revenue models revolve around a diverse mix of advertising, devices, software, cloud services, and ecommerce. Carrier-neutral providers, to simplify, rent network infrastructure to other businesses. Telcos sell subscription and pay-as-you-go services for communications services, including bandwidth, video, mobility, and enterprise services. There is a huge amount of variety in these discrete market segments. What’s more important, though, is that the three segments rely on each other in important ways. Carrier-neutral players get most of their revenues from telcos & webscalers needing to fill gaps in network coverage and accelerate time to market. Telcos rely on CNNOs to lower their cost of operations, and need webscalers to provide services and apps which make their network worth using beyond telephony. Webscalers lack last mile access networks and can only deliver their services to the mass market over telco infrastructure. Webscalers also, despite big capex outlays, can only blanket the globe with data centers by partnering with CNNOs for collocation.
This interdependence will grow. The big cloud providers in the webscale market, for instance, have targeted the telecom vertical and found success; AWS, Azure and GCP combined for about $2.6B in revenues from telcos in 2021. Telcos are making some big bets on cloud technology as they deploy 5G core networks. Both telcos and webscalers want to provide seamless, resilient network coverage, including at the edge, and can’t build it all themselves. As a result, they’ll need to scale up their partnerships with carrier-neutral players like Equinix and American Tower/CoreSite. CNNOs are increasingly taking over the “dumb pipe” aspects of the network, and to be competitive and upsell they will integrate assets across fiber, cell tower and data center.
Key findings by network operator type
This report includes detailed breakouts for each of the three network operator types. Here is a summary of some of the key findings, by segment:
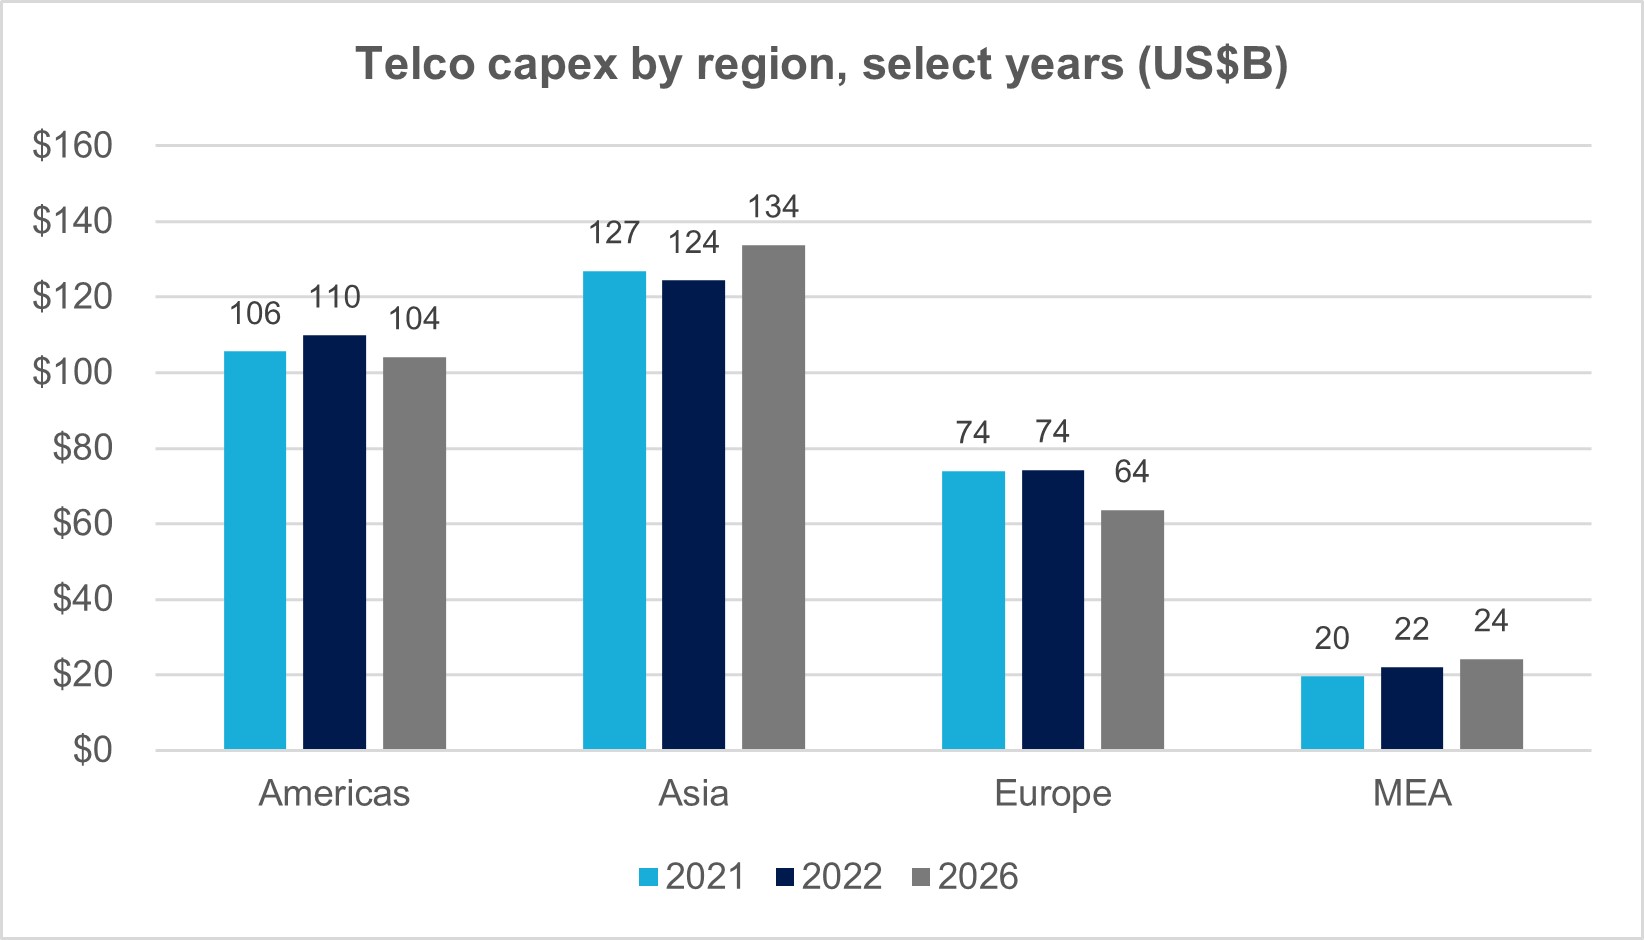
Telcos: from $1.888 trillion in 2021, revenues will grow at an average annual growth rate (CAGR) of 1.3% to just over $2 trillion in 2026. Capex will stay above $330B for the next three years but decline after that, hitting about $326B in 2026 (the same figure as 2021). Global telco capital intensity saw its annual peak in 2021, at 17.3%, the same figure as 2015 at the height of 4G builds; it will fall to 16.2% by 2026. Software will grow as a percent of total capex, but at a slower rate than we anticipated in previous forecasts; it will hit 20% of total in 2026. Network operations opex will grow an average of 4% per year through 2026, reaching $329B in 2026, around the same amount as spent on capex. Telcos will continue to reduce headcount by revamping processes, investing in digital transformation and adopting automation; total employees will be about 4.32 million in 2026, from 4.73M in 2021. Spending on employees (labor costs), however, will continue to rise on a per-person basis, reaching just above US$70K by 2026, from about US$58K in 2021. Regionally, the Americas region will maintain its share of global capex at around 32%, Asia will rise a bit to 41% by 2026, Europe will fall a couple of percentage points, and MEA will gain slightly. There are year-by-year variations and country differences underlying these regional trends.
Webscalers: from $2.14 trillion in 2021, revenues will grow to about $3.67 trillion by 2026. As in the past, some of this growth will come from M&A, as for instance Microsoft’s pending acquisition of Activision Blizzard. Webscale capex will rise from $175B in 2021 to $276B in 2026, still less than the telecom market but not far behind. Amidst this growth the capex to revenues ratio (capital intensity) will dip from 8.2% in 2021 to 7.5% in 2026. Network/IT capex will grow a bit faster than “all other capex” (mostly property and logistics), and will account for 45% of total capex in 2026, from 41% in 2021. Webscale employment will grow to about 6.7 million by 2026, from 4.1 million in 2021.
CNNOs: while a much smaller market than the other two, CNNO revenues will grow fastest of the three, reaching $158 billion by 2026, from $89B in 2021. Some of this is organic growth, especially in the data center market; new buildouts are happening worldwide, some driven by private equity and other asset management funds. M&A will continue to be a big factor in this sector’s growth, as telcos spin out assets, both towers and data centers, and established CNNOs acquire assets developed initially by private players. CNNOs’ capital intensity will rise a bit over the next three years due to data center investments, dropping back to 36% by 2026, a bit higher than 2021’s 35% result. CNNOs’ total headcount will be about 152K in 2026, from 102K in 2021. Data centers owned and operated by CNNOs are likely to hit 1,760 by 2026 (2021: 1,062); towers, 4.08M (2021: 3.16M); and, fiber route miles totaling 1.07 million (2021: 792K).
Contrasting this current forecast with that published in December 2021, the biggest numeric changes include: weaker revenue growth outlook in telecom, especially in Europe over the next two years; slightly faster headcount reduction in telecom; slower revenue growth in webscale for the next two years, but faster following this period; higher overall level of tech investment in webscale (both capex and R&D spend).
- Table Of Contents
- Figures & Charts
- Coverage
- Visuals
Table Of Contents
Key sections include:
- Abstract
- Total Network Operator Market Projections
- TNO Projections
- TNO Regional Split Projections
- WNO Projections
- CNNO Projections
- Top spenders based on 2021 capex
- About
Figures & Charts
Totals tab:
- Revenue by operator type, 2011-26 (US$B)
- Capex by operator type, 2011-26 (US$B)
- Capex by operator type, 2011-26: % of total
- Capital intensity by operator type, 2011-26
- Employees by operator type (M)
- Revenues/employee by operator type (US$K)
- Capex forecast by segment: June 2022 v. Dec. 2021 outlook, % difference
- Capex forecast by segment: June 2022 v. Dec. 2021 outlook, $B difference
- Top 50 spending operators, 2021 capex ($B)
TNO Projections tab:
- Telcos: Revenues ($B) vs. capital intensity
- Software capex in US$B and as % of total capex
- Telco opex components: 2016, 2021 and 2026
- Telcos: Capex and network operations opex ($B)
- Telcos: Employees vs. average labor cost per employee ($K)
- Telcos: Labor cost opex in US$B and as % of Opex ex-D&A
- Telco margins, actual and forecast
- June 2022 vs. Dec 2021 forecast: % changes in key metrics
TNO_Regional Split tab:
- Revenues by region: 2016, 2021, and 2026 (US$B)
- Telco capex by region, select years (US$B)
- Telcos: capital intensity by region
- Capex by region, % global
- Capex by region: June 2022 vs. Dec 2021 Forecast
- Telco capital intensity for last four forecasts
WNO Projections tab:
- Webscale revenues and capital intensity
- Webscale capital intensity by company HQ
- Webscale capex by company HQ (US$B)
- Webscale capex by type (US$B)
- Webscale R&D as % of revenues by company HQ
- Webscale revenue per employee ($K) by company HQ
- Percent change in outlook, June 2022 vs. Dec 2021 forecast
- Webscale capex by type: % change in forecast, 6/22 vs 12/21
CNNO Projections tab:
- Carrier-neutral operators: Revenues and capital intensity
- CNNO employees and revenues per employee
- CNNO Towers and Tenancy Ratio, global ex-China
- Number of data centers and average net rentable floorspace (in square feet) per data center
- % difference in key metrics: June 2022 vs. Dec 2021 forecast
- CNNO capex ($B): June 2022 vs. Dec 2021 forecast
- Capital intensity: 2011-21 by segment and 2022-26 average
- CNNO capex by segment, 2011-21 (US$B)
Coverage
This forecast report addresses three large segments of network operators, covering nearly 200 operators in total, specifically:
| Segment | Company name |
| Carrier-neutral | American Tower |
| Carrier-neutral | Arqiva |
| Carrier-neutral | Balitower |
| Carrier-neutral | Bharti Infratel |
| Carrier-neutral | Cellnex |
| Carrier-neutral | China Tower |
| Carrier-neutral | Chorus Limited |
| Carrier-neutral | Cogent |
| Carrier-neutral | CoreSite Realty |
| Carrier-neutral | Crown Castle |
| Carrier-neutral | CyrusOne |
| Carrier-neutral | Digital Realty |
| Carrier-neutral | DuPont Fabros |
| Carrier-neutral | EI Towers |
| Carrier-neutral | Equinix |
| Carrier-neutral | GDS Data Centers |
| Carrier-neutral | GTL Infrastructure |
| Carrier-neutral | GTT Communications |
| Carrier-neutral | Internap |
| Carrier-neutral | Interxion |
| Carrier-neutral | Inti Bangun Sejahtera |
| Carrier-neutral | Inwit |
| Carrier-neutral | Level 3 |
| Carrier-neutral | Lumos |
| Carrier-neutral | NBN Australia |
| Carrier-neutral | QTS Realty |
| Carrier-neutral | Sarana Menara Nusantara |
| Carrier-neutral | SBA Communications |
| Carrier-neutral | Solusi Tunas Pratama |
| Carrier-neutral | Superloop |
| Carrier-neutral | Switch |
| Carrier-neutral | TDF Infrastructure/Arcus |
| Carrier-neutral | Telesites |
| Carrier-neutral | Telxius/Telefonica |
| Carrier-neutral | Tower Bersama Infrastructure |
| Carrier-neutral | Uniti Group |
| Carrier-neutral | Zayo |
| Telco | A1 Telekom Austria |
| Telco | Advanced Info Service (AIS) |
| Telco | Airtel |
| Telco | Altice Europe |
| Telco | Altice USA |
| Telco | America Movil |
| Telco | AT&T |
| Telco | Axiata |
| Telco | Axtel |
| Telco | Batelco |
| Telco | BCE |
| Telco | Bezeq Israel |
| Telco | Bouygues Telecom |
| Telco | BSNL |
| Telco | BT |
| Telco | Cable ONE, Inc. |
| Telco | Cablevision |
| Telco | Cell C |
| Telco | Cellcom Israel |
| Telco | CenturyLink |
| Telco | Cequel Communications |
| Telco | Charter Communications |
| Telco | China Broadcasting Network |
| Telco | China Mobile |
| Telco | China Telecom |
| Telco | China Unicom |
| Telco | Chunghwa Telecom |
| Telco | Cincinatti Bell |
| Telco | CK Hutchison |
| Telco | Clearwire |
| Telco | Cogeco |
| Telco | Com Hem Holding AB |
| Telco | Comcast |
| Telco | Consolidated Communications |
| Telco | Cyfrowy Polsat |
| Telco | DEN Networks Limited |
| Telco | Deutsche Telekom |
| Telco | Digi Communications |
| Telco | DirecTV |
| Telco | Dish Network |
| Telco | Dish TV India Limited |
| Telco | DNA Ltd. |
| Telco | Du |
| Telco | EE |
| Telco | Elisa |
| Telco | Entel |
| Telco | Etisalat |
| Telco | Fairpoint Communications |
| Telco | Far EasTone Telecommunications Co., Ltd. |
| Telco | Frontier Communications |
| Telco | Globe Telecom |
| Telco | Grupo Clarin |
| Telco | Grupo Televisa |
| Telco | Hathway Cable & Datacom Limited |
| Telco | Idea Cellular Limited |
| Telco | Iliad SA |
| Telco | KDDI |
| Telco | KPN |
| Telco | KT |
| Telco | Leap Wireless |
| Telco | LG Uplus |
| Telco | Liberty Global |
| Telco | M1 |
| Telco | Manitoba Telecom Services |
| Telco | Maroc Telecom |
| Telco | Maxis Berhad |
| Telco | Megafon |
| Telco | MetroPCS Communications |
| Telco | Millicom |
| Telco | Mobile Telesystems |
| Telco | MTN Group |
| Telco | MTNL |
| Telco | NTT |
| Telco | Oi |
| Telco | Omantel |
| Telco | Ono |
| Telco | Ooredoo |
| Telco | Orange |
| Telco | PCCW |
| Telco | PLDT |
| Telco | Proximus |
| Telco | Quebecor Telecommunications |
| Telco | Rakuten |
| Telco | Reliance Communications Limited |
| Telco | Reliance Jio |
| Telco | Rogers |
| Telco | Rostelecom |
| Telco | Safaricom Limited |
| Telco | Sasktel |
| Telco | Shaw |
| Telco | Singtel |
| Telco | SITI Networks Limited |
| Telco | SK Telecom |
| Telco | Sky plc |
| Telco | SmarTone |
| Telco | SoftBank |
| Telco | Spark New Zealand Limited |
| Telco | Sprint |
| Telco | StarHub |
| Telco | STC (Saudi Telecom) |
| Telco | SureWest Communications |
| Telco | Swisscom |
| Telco | Taiwan Mobile |
| Telco | Tata Communications |
| Telco | Tata Teleservices |
| Telco | TDC |
| Telco | TDS |
| Telco | Tele2 AB |
| Telco | Telecom Argentina |
| Telco | Telecom Egypt |
| Telco | Telecom Italia |
| Telco | Telefonica |
| Telco | Telekom Malaysia Berhad |
| Telco | Telenor |
| Telco | Telia |
| Telco | Telkom Indonesia |
| Telco | Telkom SA |
| Telco | Telstra |
| Telco | Telus |
| Telco | Thaicom |
| Telco | Time Warner |
| Telco | Time Warner Cable |
| Telco | TPG Telecom Limited |
| Telco | True Corp |
| Telco | Turk Telekom |
| Telco | Turkcell |
| Telco | Veon |
| Telco | Verizon |
| Telco | Virgin Media |
| Telco | Vivendi |
| Telco | Vodafone |
| Telco | Vodafone Idea Limited |
| Telco | VodafoneZiggo |
| Telco | Wind Tre |
| Telco | Windstream |
| Telco | Zain |
| Telco | Zain KSA |
| Telco | Ziggo |
| Webscaler | Alibaba |
| Webscaler | Alphabet |
| Webscaler | Altaba |
| Webscaler | Amazon |
| Webscaler | Apple |
| Webscaler | Baidu |
| Webscaler | ChinaCache |
| Webscaler | Cognizant |
| Webscaler | eBay |
| Webscaler | |
| Webscaler | Fujitsu |
| Webscaler | HPE |
| Webscaler | IBM |
| Webscaler | JD.COM |
| Webscaler | |
| Webscaler | Microsoft |
| Webscaler | Oracle |
| Webscaler | SAP |
| Webscaler | Tencent |
| Webscaler | |
| Webscaler | Yandex |
Visuals