By Matt Walker
Report summary
This interactive spreadsheet model is a detailed financial and operational review of the carrier-neutral network operator (CNNO) market for the 2011-2021 period. This report tracks 45 CNNOs across the globe, including 10 focused primarily on bandwidth/fiber infrastructure, 15 data center specialists, and 20 tower CNNOs. The CNNOs in this study have all been publicly held entities and reported audited financials at some point in the 2011-21 timeframe; some are now private, or have been acquired by other CNNOs.
CNNOs play an important role in the communications market. They sell independent, carrier-neutral access to network infrastructure, including mobile tower, data center, and bandwidth/fiber assets. In 2021, CNNOs accounted for $90 billion (B) in revenues (+13% YoY), $40.8B in M&A spending (+256%), $31.1B in capex (flat vs 2020), and $240.6B in net property, plant and equipment (net PP&E; +4% YoY). They owned and operated 1,062 data centers, 2.98 million cell towers, and nearly 800K route miles of fiber. CNNOs employed just over 102,000 people at year-end 2021, about the same as in 2020.
Market directions
The CNNO market has grown significantly over the last decade. Between 2011 and 2021, most key financial metrics have risen at a compound annual growth rate (CAGR) of between 15-20%: revenues, +16.4%; capex, 18%; total debt, 18.9%; and, net PP&E, 17.9%. There are two primary reasons for this rapid, sustained growth. First, telcos are moving to (more) asset light operating models and have spun off large portions of their passive infrastructure. This continues, and CNNOs are also expanding their networks organically. Second, webscale operators offering cloud services have grown rapidly and cannot build their entire network alone. They rent both data center and bandwidth resources from CNNOs. Secondary drivers for CNNO growth include: low interest rates enabling debt-financed expansion (M&A and capex); the tax advantages of the real estate investment trust (REIT) operating model; and, the growth of the asset pool managed by private equity, an important source of funding for CNNOs.
MTN Consulting simplifies the CNNO market into segments based upon their primary investment focus: towers, data centers, and fiber/bandwidth. However, many CNNOs own multiple types of infrastructure, and this cross-ownership is growing as companies leverage benefits from economies of scope. An influx of investment from asset management funds is also pushing CNNOs towards integrated business models. PE firms are acquiring assets across multiple infra types, and blending them into new, more converged entities. Asset managers with stakes in multiple types of CNNOs include Ardian, Brookfield, Carlyle, Cordiant, EQT, GI Partners, KKR, PAG Real Estate, TPG, and Triple Point. Colony Capital’s creation, DigitalBridge, is probably the most mature example of this approach, and illustrative of where the CNNO market is headed. American Tower’s 2021 acquisition of a major data center specialist, CoreSite Realty, is another illustration.
In July 2021, MTN Consulting published a report on CNNO market directions, whose central conclusion remains valid:
“Publicly held and private equity-controlled CNNOs will seek to offer integrated ‘digital infrastructure’ to communications network operators, with a focus on the telco and webscale markets as their primary customers… One of many reasons for this integration is the challenges faced by today’s CNNOs: high levels of debt, weak cash flows, declining tenancy ratios in the tower sector, and the emergence of a need for data center and fiber buildouts at the network’s edge. There will continue to be many niche CNNOs focused on one specific type of asset, or two (e.g. towers and fiber), but the economic logic for a more integrated offering is compelling. The new breed of CNNOs will compile some of their network by M&A, as they always have, but there will be significant new investment in network expansion, especially in the data center and fiber space.”
Key findings
Key findings from this 4Q21 Market Review include:
Revenues: In 2021, global CNNO revenues rose by 13% from 2020, to $90 billion (B). That’s a bit slower than the 2011-21 CAGR of 16% but an improvement on 2020’s 8% growth. All three segments improved growth in 2021 v. the COVID-plagued 2020, but growth in the data center market was strongest: up 19.7%, to $19.9B.
Capex: CNNO capex held steady in 2021 at $31.1B (+0.4% YoY), as key players focused on M&A. The top three capex spenders were China Tower, Equinix, and Digital Realty, which accounted for about one-third of total CNNO capex.
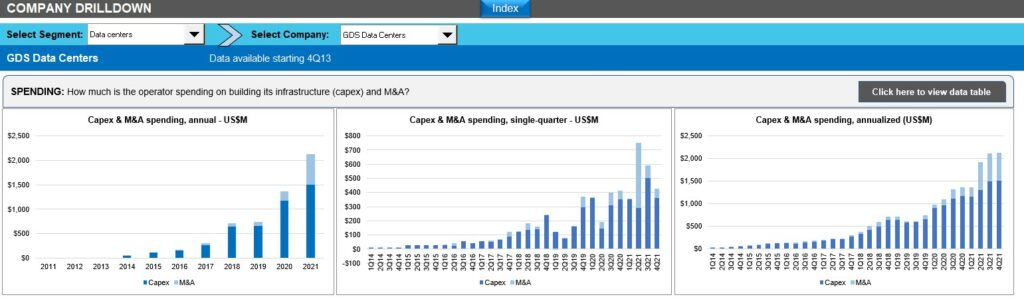
M&A spending: CNNOs often spend more on M&A than capex, and this was the case in 2021: capex of $31.1B was outpaced by $40.7B on M&A. Tower CNNOs spent by far the most on M&A in 2021. The biggest individual spenders were American Tower (CoreSite, Telxius, DataSite) and Cellnex (Altice Tower, Arqiva, CK Hutch, Hivory). In the data center segment, China-based GDS spent by far the most on M&A in 2021.
Employees: CNNOs employ about 102K people, unchanged from 2021. The sector has a relatively high revenue per employee rate (~$900K in 2021), and free cash flow per employee has been rising for several years.
Data center infra: The number of data centers operated by CNNOs (of ALL types) tracked in this study ended 2021 at 1,062, up from 987 in 2020, and just 455 in 2011; net rentable footprint per data center has been climbing since 2017.
Bandwidth infra: CNNOs operate just under 800K route miles of fiber, used mainly for wholesale or similar services; roughly 18% was owned by companies outside the bandwidth segment, notably US-based Crown Castle and the Indonesia towercos.
Tower infra: CNNOs operate nearly 2.98 million towers, including China Tower. Excluding China, the figure was ~946 thousand (K) in 2021, from about 863K in 2020 and just over 200K in 2011. Focusing on the market ex-China, prior to 2021, the average tenancy ratio had been falling since 2011, but the tenancy ratio improved somewhat in 2021, to slightly above 1.7 tenants per (occupied) tower.
CNNO market in context: CNNOs are one of three operator segments tracked at MTN Consulting, along with Telco and Webscale. The CNNO market plays a vital role in the development of these other two sectors. It remains relatively small, though. In 2021, capex spent by telcos and webscalers totaled $326 billion and $175 billion, respectively. That’s roughly 10x and 6x the level of capex recorded by CNNOs in 2021. With all the private investment into CNNOs in recent years, though, and ongoing needs from telcos to rely more on third-parties for their network operations, there are strong signs that the CNNO market will continue to bridge this gap.
MTN Consulting expects to publish an update to its network operator spending forecast in the next two months. That may include modest adjustments to the CNNO market’s outlook. However, the development of the CNNO market is largely on track with the last forecast, as published in December 2021.
- Table of Contents
- Figure & Charts
- Coverage
- Visuals
Table of Contents
- Abstract
- CNNO Segment Overview
- Analysis
- Operating Metrics
- Key Stats thru 4Q21
- Segment Drilldown
- Company Drilldown
- Company Benchmarking
- Raw Data
- Exchange Rates
- About
Figure & Charts
- Revenues by CNNO type (US$M)
- Revenues single-quarter (US$M)
- CNNO Profitability, annualized (%)
- Capex & M&A spending, single-quarter (US$M)
- Net PP&E by CNNO type (US$M)
- Number of data centers & NRSF per data center (K)
- Bandwidth fiber route miles, Global
- CNNO towers & average tenancy ratio
Below charts by total CNNO market, CNNO sub-segments, and by companies:
- Revenues: annual, single-quarter, and annualized (US$M)
- Profitability (Net Profit; Cash from operations; Free cash flow): annual, single-quarter, and annualized (US$M)
- Spending (M&A; Capex): annual, single-quarter, and annualized (US$M)
- Cash & Short-term Investments: annual and single-quarter (US$M)
- Debt (Total debt; Net debt): annual and single-quarter (US$M)
- Property, Plant & Equipment: annual and single-quarter (US$M)
- Key Ratios: Net margin; Capex/revenues; M&A/revenues; Free cash flow/revenues
- Total employees
- Revenue per employee, annualized (US$K)
- FCF per employee, annualized (US$K)
- Net PP&E per employee, annualized (US$K)
Company benchmarking charts:
- 2011 vs. 2021: company benchmark by KPI (Revenues, Net profit, Cash from operations, Capex, Free cash flow, Cash & short-term investments, Net PP&E, Total debt)
- 2011 vs. 2021: company benchmark by key ratio (Capex/revenues; Net margin; FCF margin)
- Top 5 CNNOs by sub-segment: by KPI (Revenues, Net profit, Cash from operations, Capex, Free cash flow, Cash & short-term investments, Net PP&E, Total debt)
- Top 5 CNNOs by sub-segment by Key ratio: Capex/revenues; Net margin; FCF margin
Coverage
The following companies are included in this Market Review:
21Vianet
American Tower
Arqiva
Balitower
Bharti Infratel
Cellnex
China Tower
ChinData
Chorus Limited
Cogent
CoreSite Realty
Crown Castle
CyrusOne
Cyxtera
Digital Realty
DuPont Fabros
EI Towers
Equinix
GDS Data Centers
GTL Infrastructure
GTT Communications
IHS Towers
Internap
Interxion
Inti Bangun Sejahtera
Inwit
Keppel DC REIT
Level 3
Lumos
NBN Australia
NEXTDC
QTS Realty
Sarana Menara Nusantara
SBA Communications
Solusi Tunas Pratama
Summit Digitel
Sunevision
Superloop
Switch
TDF Infrastructure/Arcus
Telesites
Telxius/Telefonica
Tower Bersama Infrastructure
Uniti Group
Zayo
Visuals