This report is the first in MTN Consulting’s Webscale Playbook series, which analyze the “Super 8” webscale network operators (WNOs), i.e. Alibaba, Alphabet, Amazon, Apple, Baidu, Facebook, Microsoft, and Tencent. The objective of this report is to assess Amazon’s:
- latest quarterly key performance indicators including revenues, capex, opex, R&D, etc.
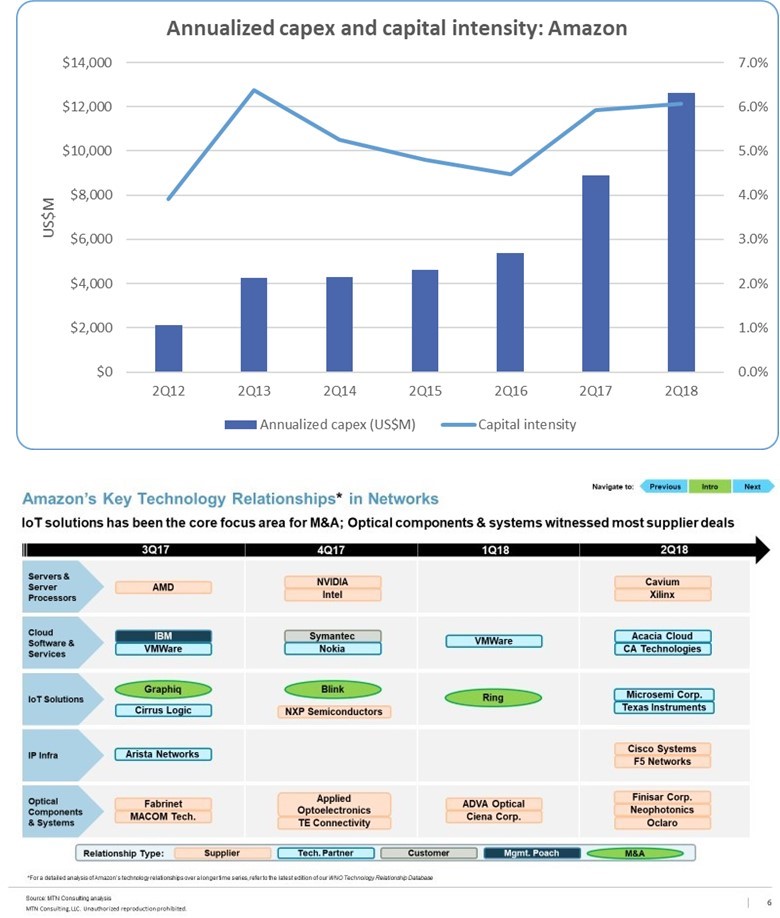
- network vendor relationships, M&A, and partnerships across different network product categories
- network-related strategy
- disruptive impact on the network infrastructure market
———-
Amazon has evolved leaps and bounds since its creation. The company’s businesses beyond e-commerce include physical stores, cloud computing, audio/video streaming, advertising, and devices – all of which have millions of customers/users serviced by a strong network infrastructure. The sheer growth across its businesses in the recent years has primed Amazon as one of the leading operators in the network space. To cope up with its ever increasing network-related demand, the company is not just spending massively.to shore up its infrastructure through vendor partnerships, but also developing its own hardware.
Below are a few highlights from the report:
- As a percentage of revenues, Amazon spends more on R&D than capex, which is typical of WNOs. The gap between the two spending, however, is somewhat shrinking which goes to show Amazon’s greater efforts in building datacenters and warehouses in the recent years. Amazon has emerged as the top R&D spender among WNOs over the past two years, due to Prime Video.
- Amazon currently manufactures some of the network components such as routers, chips, network interface cards, and network gears to meet the growing needs of its cloud business (AWS). The internet giant, known for disruption, could foray into the enterprise networking market and sell its own custom-made hardware by 2020, taking the incumbent network vendors head-on.
- However, Amazon is also creating a host of new opportunities for network vendors, as it looks to disrupt different industries such as automotive (driverless cars) and healthcare (online pharmacy and heart-rate detection device), both requiring a strong network infrastructure to enable data transfers and communication between sensors and components.
Report format: PDF (PPT available upon request)
- Table Of Contents
- Figure & Charts
- Coverage
- Visuals
Table Of Contents
- Latest earnings takeaways
- Revenue Analysis
- Capex & R&D Analysis
- Key tech relationships
- Amazon’s network strategy
- Amazon’s disruption effect
Figure & Charts
- Amazon Revenues: 1Q17 – 2Q18
- QoQ Growth Rate(CAPEX vs OPEX): 1Q17 – 2Q18
- Profitability Margins: 1Q17 – 2Q18
- Revenues (Ann. & Actuals) & YoY Growth
- FY2017 Business Revenue Split (MTN Consulting estimates*)
- Annualized Capex and R&D, % Revenues
- Amazon’s annualized share of WNO network & IT capex
Coverage
Visuals