By Matt Walker
Revenues for the webscale sector of network operators passed the $2 trillion mark in 3Q21, on an annualized basis, growing 29.1% YoY to reach $2.06T. The cloud is part of this; for the top three (AWS, Azure and GCP), cloud revenues for the 3Q21 annualized period totaled $105.4B, up 35% YoY. Cloud growth is just a sliver of the webscale revenue pie, though. Total revenues for the webscale sector passed the $1 trillion mark just over 4 years ago, in the 2Q17 annualized period. Big gains in ecommerce, advertising, and device revenues account for most of the growth. The webscale sector is now comfortably larger than telecom, which recorded $1.89 trillion in revenues in the 4Q20- 3Q21 period.
On a capex basis, telecom remains far ahead, with $317 billion in 3Q21 annualized capex. That’s nearly double the webscale total of $165B, but webscale is gradually bridging this gap: in the 3Q21 annualized period, webscale capex spiked 35% YoY. In addition, webscalers invest heavily in R&D, and have bleeding-edge requirements for the technology they deploy in their network. That has led them to drive the creation of many new innovations in network infrastructure over the last few years. These span semiconductors, optical transmission and components, intent-based routing, network automation, and other areas. Facebook is perhaps the most influential of all webscalers due in part to its openness and support for the OCP and TIP organizations.
Europe records best recent revenue growth
By region, the Americas is dominant in the webscale world, accounting for 43.8% of annualized revenues through 3Q21. Asia-Pacific follows with a 35.0% revenue stake, then Europe (18.5%) and MEA (2.8%). The strongest recent growth is coming from Europe, which saw annualized revenues spike 37.7% YoY in 3Q21. In fact, 3Q21 was the fourth straight quarter when Europe’s YoY revenue growth outpaced all other regions. US-based webscalers are expanding their penetration of the European market, investing in greater cloud coverage and ecommerce logistics. Apple’s device sales in Europe have also been a factor: Apple’s single quarter revenues in Europe were $21.5B in 3Q21, up 65% from $13.0B in 3Q20.
FCF margins and cash reserves both hit by capex surge, but net margins up
For the webscale market as a whole, free cash flow margins have hovered in the 17-21% range over the last few years. The capex surge of 2018 dragged down FCF margins a bit. The recent capex surge has also hit average FCF margins, which ended 3Q21 at 17.8% annualized (3Q20: 19.1%).
Net profit margins, though, have risen. After hovering around 17% for much of 2019 and 2020, they have grown recently to above 20%, ending 3Q21 at 20.2% (annualized). The improvement is due to broad-based gains recorded by webscalers in ecommerce sales, ad and cloud revenues, and 5G device sales. For 3Q21 single quarter, net profit margins fell vs. 3Q20 for a number of companies, including Alibaba, Amazon, Baidu, Facebook, Tencent and IBM, but Alphabet, Apple and Microsoft all saw substantial improvements.
Cash on hand, including short-term liquid investments, amounted to $754 billion for the webscale sector at the end of 3Q21, up about 1% YoY. Total debt rose 7% YoY to $531B. As a result, net debt (debt minus cash) in September 2021 was -$223B for the webscale sector, from -$250B in September 2020. The companies with the biggest stockpiles of cash (and equivalents) are Alphabet and Microsoft, with $142 and $131 billion, respectively. Facebook has just $58B, but no debt at all. Apple, HPE, IBM, Oracle, SAP and Tencent all have significantly more debt than cash.
Top 8 webscalers remain the biggest spenders, but Oracle and Twitter also important
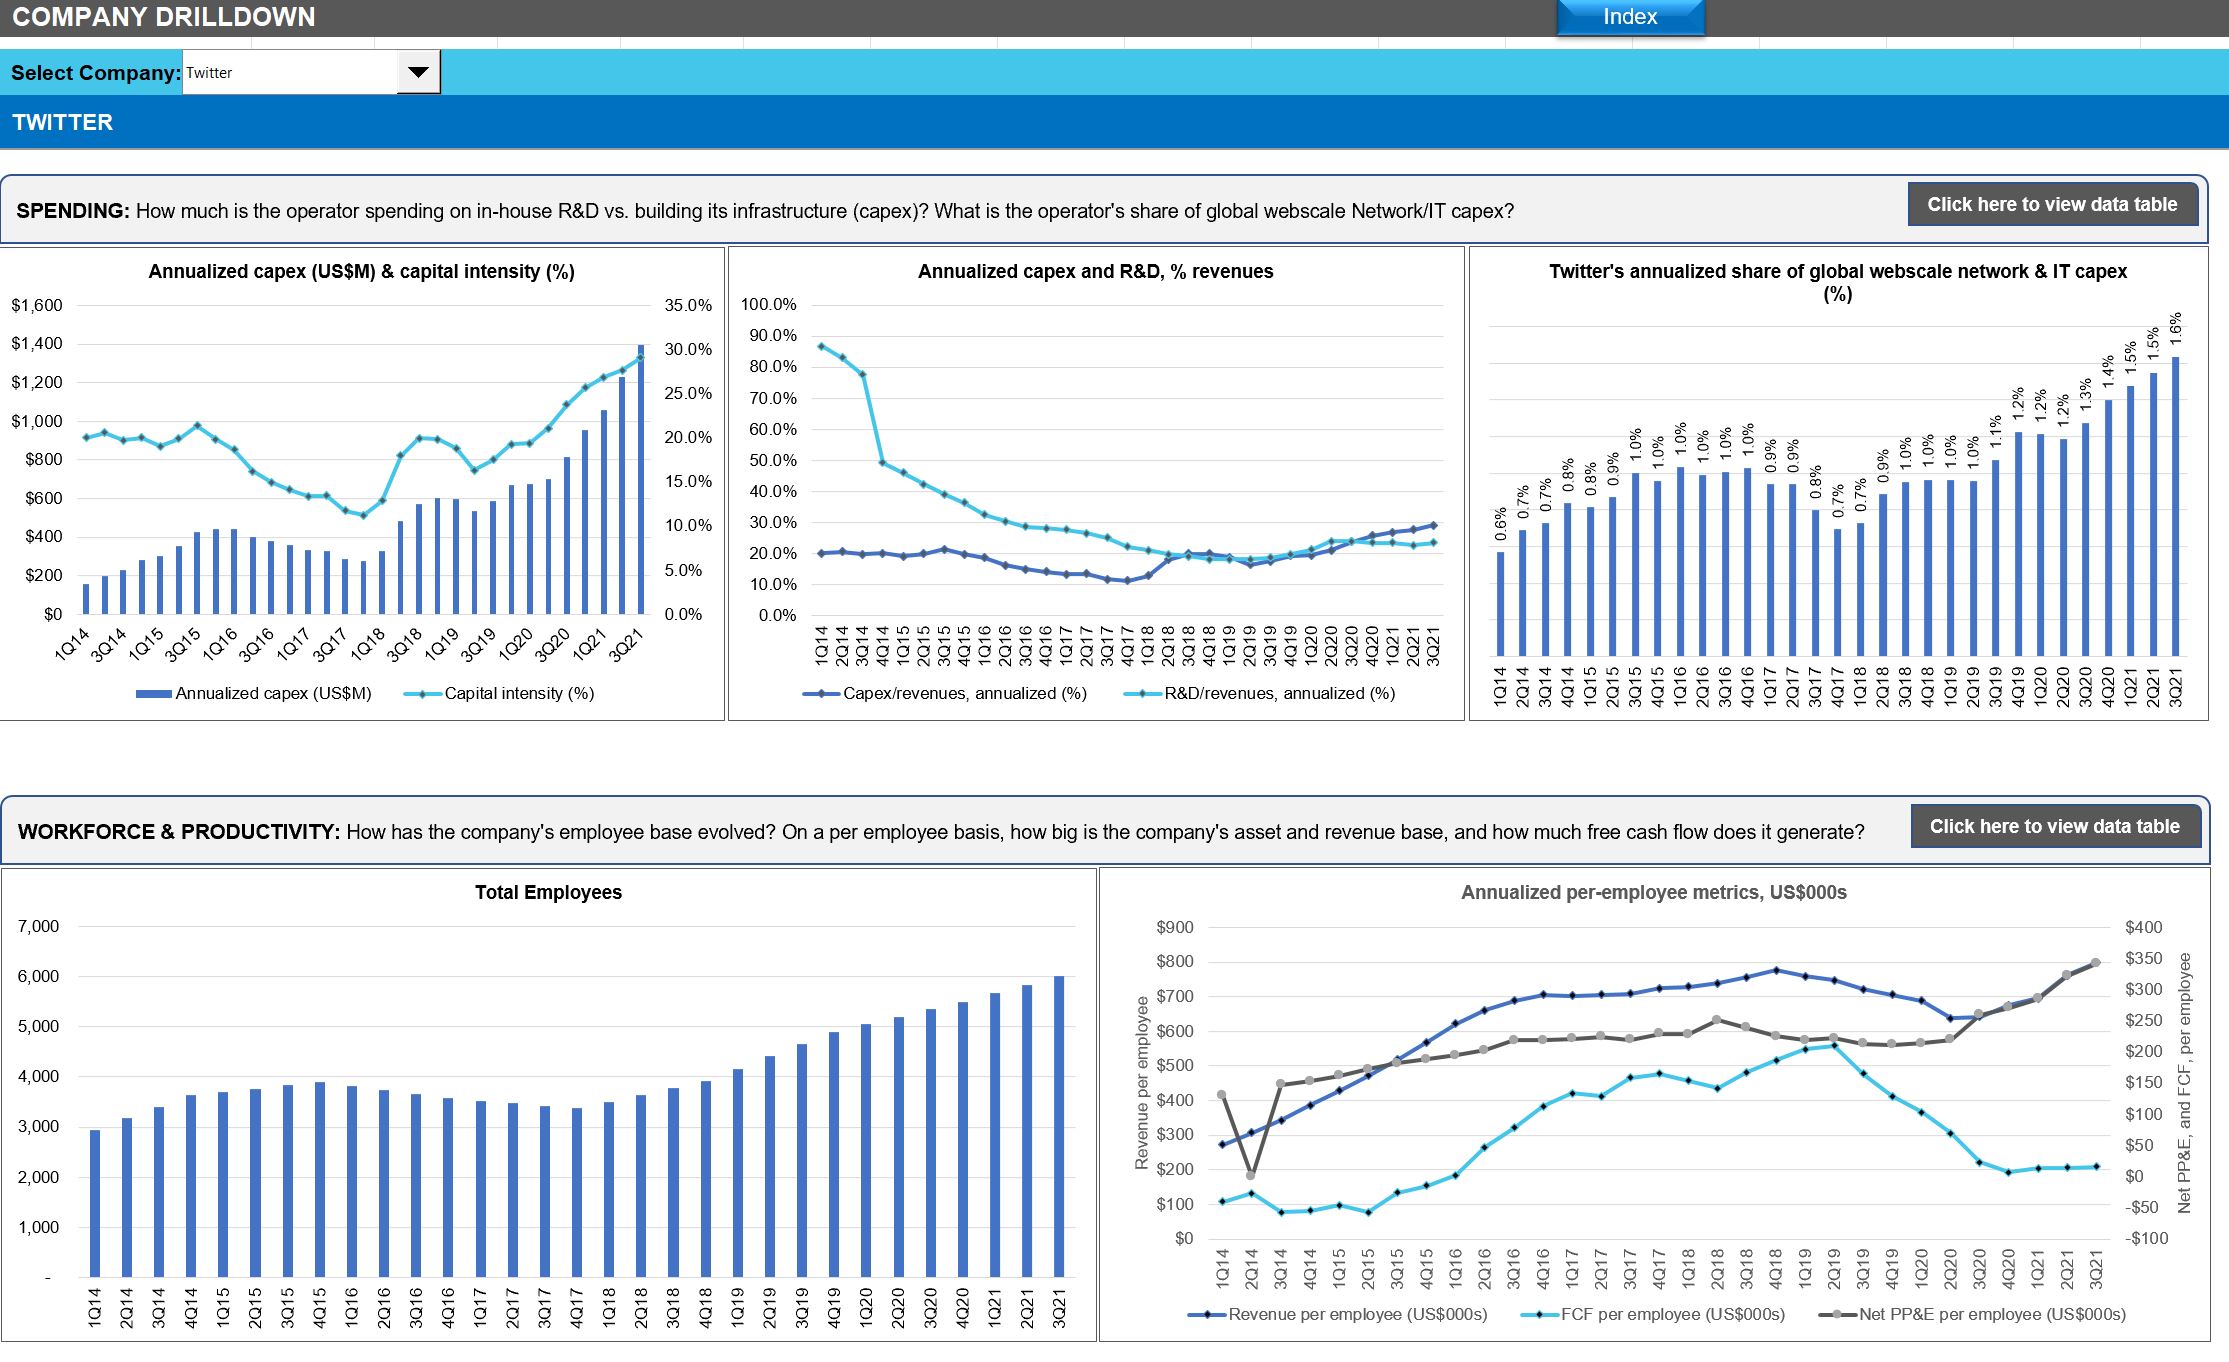
This webscale tracker considers a “Top 8” group of companies as being, traditionally, the most influential in the market’s overall technology development and investments. These include three Chinese Internet companies (Alibaba, Baidu and Tencent), the world’s leading smartphone provider (Apple), the world’s biggest social media company (Facebook), and the leading three cloud providers: Alphabet, Amazon, and Microsoft. Ranking webscalers based on their share of tech capex, Amazon tops the list easily, accounting for 28.5% of annualized network/IT capex through 3Q21. Amazon is followed by Alphabet (17.0%), Microsoft (13.6%), Facebook (9.4%), Tencent (6.3%), Apple (5.1%), Oracle (2.8%), Alibaba (2.7%), Baidu (1.8%), and Twitter (1.6%). Amazon’s recent capex surge is well known, and has supported expansion of the company’s AWS footprint and service offerings. Oracle has been quieter but its capex growth is equally impressive, from a smaller base: for 3Q21 alone, capex was $1.1B, up from $0.4B in 3Q20. Twitter, a new addition to our webscale coverage, spends more on network/IT capex as a percentage of revenues (over 23%) than all other webscalers, due to ongoing software development and construction of its first owned data center.
The facilities these webscale players are building can be immense. For instance, Microsoft started construction recently on two new data centers in Des Moines Iowa, each of which costs over $1B and measures over 167K square meters (1.8 million square feet). These two are part of a cluster in the area, as is often the case; Microsoft already has three facilities around Des Moines. Facebook is working on a project in DeKalb, Illinois, roughly half the size at 84.2K square meters, costing US$800M and spreading across 500 acres of land. This construction project was announced in 2020 but won’t complete until 2023. These are just two examples of the many big facilities in the works in the webscale sector.
Who benefits from webscale capex?
The network spending of big webscalers is centered around immense, “hyperscale” data centers and undersea cable systems that support network traffic from the tech companies’ online retail, video, and social media platforms, along with cloud services. Webscale network operators (WNOs) may also own access networks, typically using fiber, microwave or mmWave, and even fixed satellite. WNOs exploring outer space for providing connectivity include Amazon, Apple, Alphabet, Facebook, and Microsoft.
A broad set of vendors are benefiting from WNO capex spending – from semiconductor players selling into the data center market (Intel, AMD, Nvidia, Broadcom, etc), to optical components & transport vendors selling into data center interconnect markets (e.g. Infinera, II-VI, Lumentum/Neophotonics), to contract manufacturers of white box/OCP servers (e.g. Wistron and Quanta). Cisco and Ciena, for instance, two important suppliers to the telco market, recorded approximately $3.7B and $0.8B in annualized 3Q21 sales to the webscale sector. The construction industry also sees webscale as important, as much of their capex is for development of data center properties.
Network investment outlook
Looking ahead to 2022 and beyond, here is a brief summary of investment outlook (as available) for key webscalers:
- Amazon: no concrete recent guidance on network/IT capex. It has hinted it will slow after the current surge, but “work is not done yet” in its investments in middle and last-mile capacity for logistics (which would be counted as “other capex”, not network/IT-related).
- Alphabet: recent capex focused on servers, real estate, and “fit-outs and ground-up construction of office facilities” for expanded headcount. Recent expansions into Warsaw, Delhi, Melbourne and Toronto in 2021, covering 28 regions to date, with plans for 10 more.
- Microsoft: expects 4Q21 capex to be similar to 3Q21. A year ago, 4Q20 was down 15% relative to 3Q20. Hints at capex moderation in future, though, saying “We’re covering 90% of the globe and like 95% of the GDP, and so we feel good about where we’re at, but we still need to add capacity in those geos. But I do think that we’ve seen a more moderated CapEx spend maybe on a relative basis than we historically did.”
- Facebook: latest capex guidance for CY2021 is $19B, from range of $19-21B provided earlier. Expects capex to jump to $29-34B range in 2022, to target data centers, servers, network infrastructure and office facilities. Explains that “a large factor driving the increase in CapEx spend is an investment in our AI and machine learning capabilities, which we expect to benefit our efforts in ranking and recommendations for experiences across our products…”
- Tencent: no concrete guidance but hints at Facebook-like investments in the “metaverse,” says it has a lot of the building blocks needed, for example, “a lot of gaming experiences…very strong social networking experience…engine capability, we have AI capability, we have the capability to build a large server architecture that can serve a huge number of concurrent users. We are very experienced in managing digital content economies as well as real-life digital assets.”
- Apple: nothing concrete on capex specifically, but in April it announced “$430 billion in contributions to the US economy include direct spend with American suppliers, data center investments, capital expenditures in the US, and other domestic spend…”
- Oracle: says it is on track to spend $4B in capex for the 12 months ended May 2022, nearly double the $2.1B spent in 3Q20-2Q21, as it pushes to expand cloud footprint quickly.
- Alibaba: no concrete guidance but 3Q21 call said “In cloud computing and data intelligence, we will strengthen our market leadership by further enhancing our core product and technology capability.” At its Apsara conference in October, unveiled several new proprietary products, including Yitian 710 server chip, the X-Dragon architecture, Panjiu cloud-native server series, Alibaba AI and big data platform and a new generation of PolarDB database. It has global aspirations for its IaaS and PaaS services.
- Baidu: hasn’t addressed capex recently but on 3Q21 earnings call cited strong cloud demand growth, saying it “…delivered another solid quarter in Q3 with Baidu Core revenue growing 15% year-over-year driven by AI cloud growing 73% year-over-year.”
- Twitter: expects 4Q21 capex of $85-$135M as it completes construction of its new data center; this is down from $323M in 4Q20.
Forecast outlook
We are in the final stages of preparing our latest forecast of network operator spending. The actual webscale market for 2021 has comfortably outpaced our projections from a year ago, and there are positive signs for continued tech investment growth into 2022. We will provide detailed figures in the forthcoming forecast, which will also include telco and carrier-neutral operator projections.
- Table Of Contents
- Figures & Charts
- Coverage
- Visuals
Table Of Contents
- Abstract
- Analysis
- WNO Market: Key Stats
- Company Drilldown
- Top 8 WNOs
- Company Benchmarking
- Regional Breakouts
- Raw Data
- Exchange Rates
- About
Figures & Charts
- Key Metrics: Growth rates, Annualized 3Q21/3Q20 vs. 2011-20
- WNO Revenues: Single-quarter & annualized (US$M)
- Top 8 WNOs: YoY revenue growth in 3Q21
- Annualized profitability: WNOs
- Free cash flow per employee, 3Q21 annualized (US$)
- FCF Margins vs. Net Margins, 3Q21 annualized
- Advertising revenues as % total (FY2020)
- Annualized capex and R&D spending: WNOs (% revenues)
- WNO capex by type, Annualized: 3Q15-3Q21 (US$M)
- Network & IT capex as share of revenues, 3Q21 annualized
- R&D expenses as % revenues, Top 8 WNOs (3Q21 annualized)
- Acquisition spending vs. capex spending, 3Q15-3Q21 annualized (US$M)
- Net PP&E per employee (US$’ 000) – 3Q21
- Ranking the Webscale Network Operators: Revenues; R&D; Capex; Network & IT capex – 2020 & 3Q21 (US$B)
- Revenues: annual, single-quarter, and annualized (US$M)
- Profitability (Net Profit; Cash from operations; Free cash flow): annual, single-quarter, and annualized (US$M)
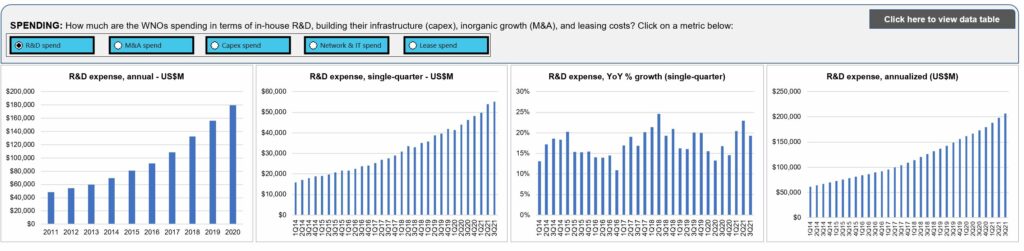
- Spending (R&D; M&A; Capex; Network & IT capex; Lease): annual, single-quarter, and annualized (US$M)
- Cash & Short-term Investments: annual and single-quarter (US$M)
- Debt (Total debt; Net debt): annual and single-quarter (US$M)
- Property, Plant & Equipment: annual and single-quarter (US$M)
- Key Ratios: Net margin; R&D/revenues; Capex/revenues; Network & IT capex/revenues; Free cash flow/revenues; Lease costs/revenues – annual and annualized (%)
- Total employees
- Revenue per employee, annualized (US$K)
- FCF per employee, annualized (US$K)
- Net PP&E per employee, annualized (US$K)
- Revenues & Spending (US$M)
- Webscale Business Mix by Revenues (FY2020) – MTN Consulting estimates
- Top 10 recent acquisitions & investments
- Revenues (US$M) & YoY revenue growth (%), single-quarter: by company
- Revenues, annualized (US$M): by company
- Annualized profitability margins: by company
- Annualized capex and capital intensity: by company
- Annualized capex and R&D spending as % of revenues: by company
- Share of WNO network & IT capex, Annualized: by company
- Total employees: by company
- Annualized per-employee metrics (US$000s): by company
- Net debt (debt minus cash & stock) (US$M): by company
- 2011 vs. 2020: company benchmark by KPI (Revenues, R&D, Net profit, Cash from operations, Capex, Free cash flow, Cash & short-term investments, Net PP&E, Total debt)
- 2011 vs. 2020: company benchmark by key ratio (Capex/revenues; R&D/revenues; Net margin; FCF margin)
- Top 8 WNO’s share vs. Rest of the market: by KPI (Revenues, R&D, Net profit, Cash from operations, Capex, Free cash flow, Cash & short-term investments, Net PP&E, Total debt)
- Top 8 WNOs benchmarking by Key ratio: Capex/revenues; R&D/revenues; Net margin; FCF margin)
- Total WNO Market Revenues, by region: Latest CY; Latest Quarter; Annual trend (2011-20); Single quarter (3Q14-3Q21)
- Regional revenues by operator: Latest CY; Latest Quarter; Annual trend (2011-20); Single quarter (3Q14-3Q21)
- Top 10 operators by region: Latest CY; Latest Quarter
Coverage
| Top 8 WNOs | |||
| Alibaba | Alphabet | Amazon | Apple |
| Baidu | Microsoft | Tencent | |
| Other WNOs | |||
| Altaba | ChinaCache | Cognizant | eBay |
| Fujitsu | HPE | IBM | JD.com |
| Oracle | SAP | ||
| Yandex | |||
Visuals