By Matt Walker
The webscale sector of network operators shows no signs of slowing up.
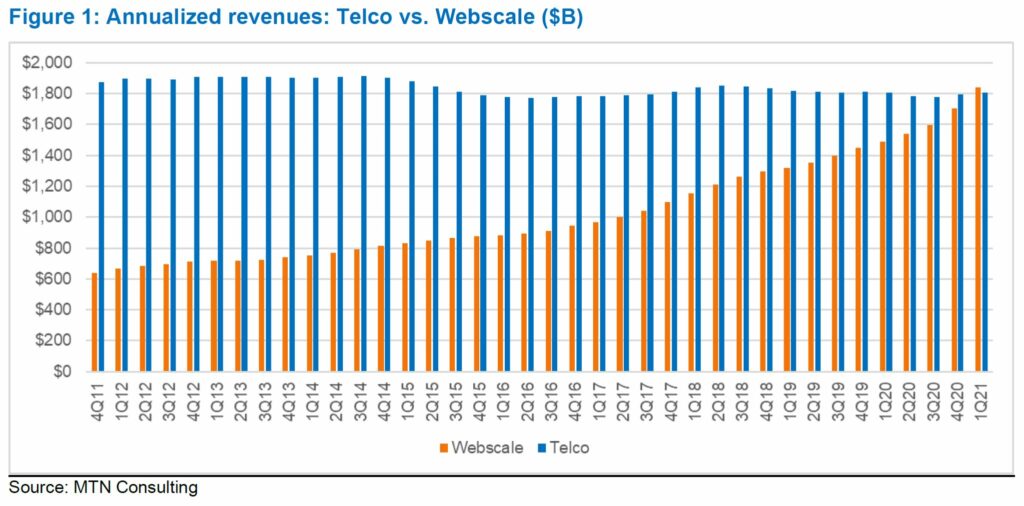
After webscale network operator (WNO) revenues surged by 18% in 2020 to $1.7 trillion (T), growth accelerated in 1Q21. Total revenues for the quarter were $490.7 billion (B), up 37% year-over-year (YoY) from 1Q20. Over the last few quarters, demand for both cloud services and ecommerce has spiked due to COVID-19, and that appears to be continuing as the pandemic ebbs. In 1Q21, the most significant growth came at Amazon and Apple. Amazon’s revenues grew 44% YoY to $108.5B, while Apple rode the 5G iPhone wave to grow revenues by an incredible 54% YoY to $89.6B. The only webscaler to face revenue erosion was Fujitsu, whose $10.0B in 1Q21 revenues were 1.1% down YoY. Most of the webscale sector’s growth in 1Q21 was organic, not due to acquisitions. The most important exception is Alibaba. Its late 2020 purchase of grocer Sun Art was a major contributor to Alibaba’s 76% YoY revenue increase in 1Q21.
Technology-related spending also grew dramatically in 1Q21, although at more moderate rates. Webscale R&D expenses climbed 20.4% YoY to $49.5B. On an annualized basis, R&D spending was 10.2% of revenues in 1Q21, down a bit from 10.8% in 1Q20. Amazon’s YoY growth was largest on an absolute basis, with its “technology and content” expenses up 33.9% to $12.5 billion. Content development is a significant piece of this. Amazon made clear the importance of content late last month by announcing the acquisition of MGM Studios. For most webscalers, though, content is a small piece of R&D, overshadowed by software, services, and device-related spending.
Capital expenditures for the webscale sector increased 28.3% YoY to $36.7 billion in 1Q21. On an annualized basis, webscale capex was $141.5 billion, up 29% YoY, and approaching half of what is spent by the telco market over 12 months. Webscale capital intensity remains far lower, though, amounting to 7.7% of revenues (annualized) in 1Q21, down slightly from 7.8% in 4Q20. The network/IT/software portion of capex has hovered around 43% of total capex for the last four quarters. In terms of growth, Amazon dominated the market in 1Q21: its capex increased by $5.3 billion versus 1Q20, to $12.1 billion (up 78% YoY). All other webscalers saw a combined capex increase in 1Q21 of just $2.4 billion. The majority (~65%) of Amazon’s capex is for its logistics and fulfillment network, not its Amazon Web Services (AWS/cloud) division. But Amazon’s Network/IT capex budget is still immense, and the company clearly does not want to lose its market leading cloud position to either Azure or GCP.
In terms of profitability, webscalers are doing just fine. Annualized net margin in 1Q21 was 19.4%, from 16.8% in 1Q20. Annualized free cash flow margins dropped slightly in 1Q21 versus 4Q20 but still averaged 19.6%, higher than 1Q20. The webscale sector’s cash stockpile also dropped a bit sequentially, but its $730.2 billion value is far higher than the sector’s $486.2 billion in total debt. Most webscalers have plenty of cash with which to expand operations, invest in networks, or acquire other companies.
The webscale sector’s main risks right now are: regulatory backlash (including pressure from telcos and consumers over privacy abuses and monopolistic behavior); a return to normalcy post-pandemic, possibly moving more commerce, education and entertainment away from the cloud; and new business models and startups stealing attention and time away from their core users, eating into ad-driven revenue streams.
- Table Of Contents
- Figures
- Coverage
- Visuals
Table Of Contents
Summary – page 2
Webscale revenues surpass $1.8 trillion on annualized basis in 1Q21 – page 3
Technology-related spending by webscale soars but at manageable clip – page 4
Profit margins remain strong – page 6
Market outlook – page 7
Appendix – page 9
Figures
Figure 1: Annualized revenues: Telco vs. Webscale ($B)
Figure 2: Webscale revenue growth, 1Q21 annualized
Figure 3: Capex and capital intensity, webscale sector
Figure 4: Webscale Network/IT/SW capex: % total, 1Q19-1Q21 (annualized)
Figure 5: R&D expense and R&D as percent of revenues, webscale sector
Figure 6: Webscale net profit and free cash flow margins, annualized
Figure 7: Big 4 tech spenders: Cash & debt, end 1Q21 (US$B)
Coverage
Companies and organizations mentioned in this report include:
Alibaba
Alphabet
Altaba
Amazon
Apple
AT&T
Baidu
ByteDance
China Mobile
ChinaCache
Cognizant
Discovery
eBay
Facebook
Fujitsu
HPE
IBM
JD.COM
LinkedIn
Meituan
MGM Studios
Microsoft
Netflix
NTT
Oracle
Orange
SAP
Sun Art Retail
Telefonica
Tencent
Twitter
Verizon
WarnerMedia
Yandex
Visuals