By Arun Menon
This market review provides a comprehensive assessment of the global telecommunications industry based on financial results through December 2020 (4Q20). The report tracks revenue, capex and employee for 138 individual telecommunications network operators (TNOs). For a sub-group of 50 large TNOs, the report also assesses labor cost, opex and operating profit trends. The report also covers annual data for other financial metrics such as debt, cash & short term investments, M&A spend and cash flow from operations for the TNO-50. Our coverage timeframe spans 1Q11-4Q20 (40 quarters). The report’s format is Excel.
ABSTRACT
4Q20 RESULTS SUMMARY
The year 2020 will always be remembered as the year of COVID-19, when a pandemic spread rapidly across the globe and brought economies to a standstill, forcing extreme changes in human behavior in the attempt to stay healthy. Network traffic patterns changed as people worked and studied from home. Service demand changed as the work & study from home crowd required resilient, high-speed connections from home and videoconferencing and collaboration tools became more important than raw connectivity. Network operators attempted to make the best of a bad situation, naturally. Cloud providers from the webscale world did this effectively, and many startups without their own networks (Zoom, in particular) grew dramatically. Telcos attempted to upsell consumer broadband and find ways to benefit from increased at-home entertainment consumption. Their record of success was mixed.
In addition to all things COVID, telecom’s 2020 was also marked by three other important trends: widespread deployment of 5G networks across all regions of the world, even if mostly at a small scale; rising telco interest in automation across their operations, and the related adoption of software-based network technologies; and, real momentum behind the Open RAN movement. The latter trend was given force by Huawei’s continued struggle to remain #1 among suppliers, due to a mix of supply chain constraints and tangible security concerns in many of its key markets. Open RAN had appeal even before Huawei’s loss of standing, as part of a broader movement towards network disaggregation. However, without Huawei as a leader in the mobile RAN, few telcos want to rely on just two large suppliers (Ericsson and Nokia) for this central aspect of their operations.
Revenues grew 3.4% YoY in 4Q20 after two horrible quarters
Telco revenues surged at year-end 2020 as economies began to recover: vaccine development news promised an eventual end to the COVID-19 pandemic. Telco revenues for 4Q20 totaled $479.7 billion (B), up 3.4% YoY from 4Q19. Revenues for the full-year of 2020 nonetheless were $1,795 million, down 1.1% YoY, roughly the same drop as experienced in 2019. The full-year fall is due largely to the pandemic’s worst quarter, 2Q20, when revenues fell 5.2% YoY. Revenues from equipment – including both 5G-enabled mobile devices and new consumer broadband CPE – were a major driver of the 4Q20 improvement. Revenue growth for core telecom services remains modest.
Capital intensity falls to 16.4% in 2020 despite 5G push
Telco capex, including software intangibles but excluding spectrum, did not see a year-end surge. For 4Q20, capex declined by 1.1% on a YoY basis to $83.9 billion. Total capex for 2020 fell 3.4% to $294.3 billion. That’s the lowest annualized figure for at least the last ten years based on our stats. China’s 5G push ended up not lifting 2020’s capex, partly because of widespread network sharing, partly because 1Q was so weak. To understand why China didn’t drive the market more, it helps to consider that measuring both “5G base stations” and “5G subscribers” is subject to China’s habit of inflating official stats in search of glory. The real capex growth stories in 2020 were NTT (+$880M YoY) and KDDI (+$468M) in Japan, as well as Vodafone (+$620M), CK Hutch (+$463M), Zain KSA (+$454M) and Bouygues Telecom (+$401M). 5G was a factor for all, with global cloud/data center construction an additional factor for NTT.
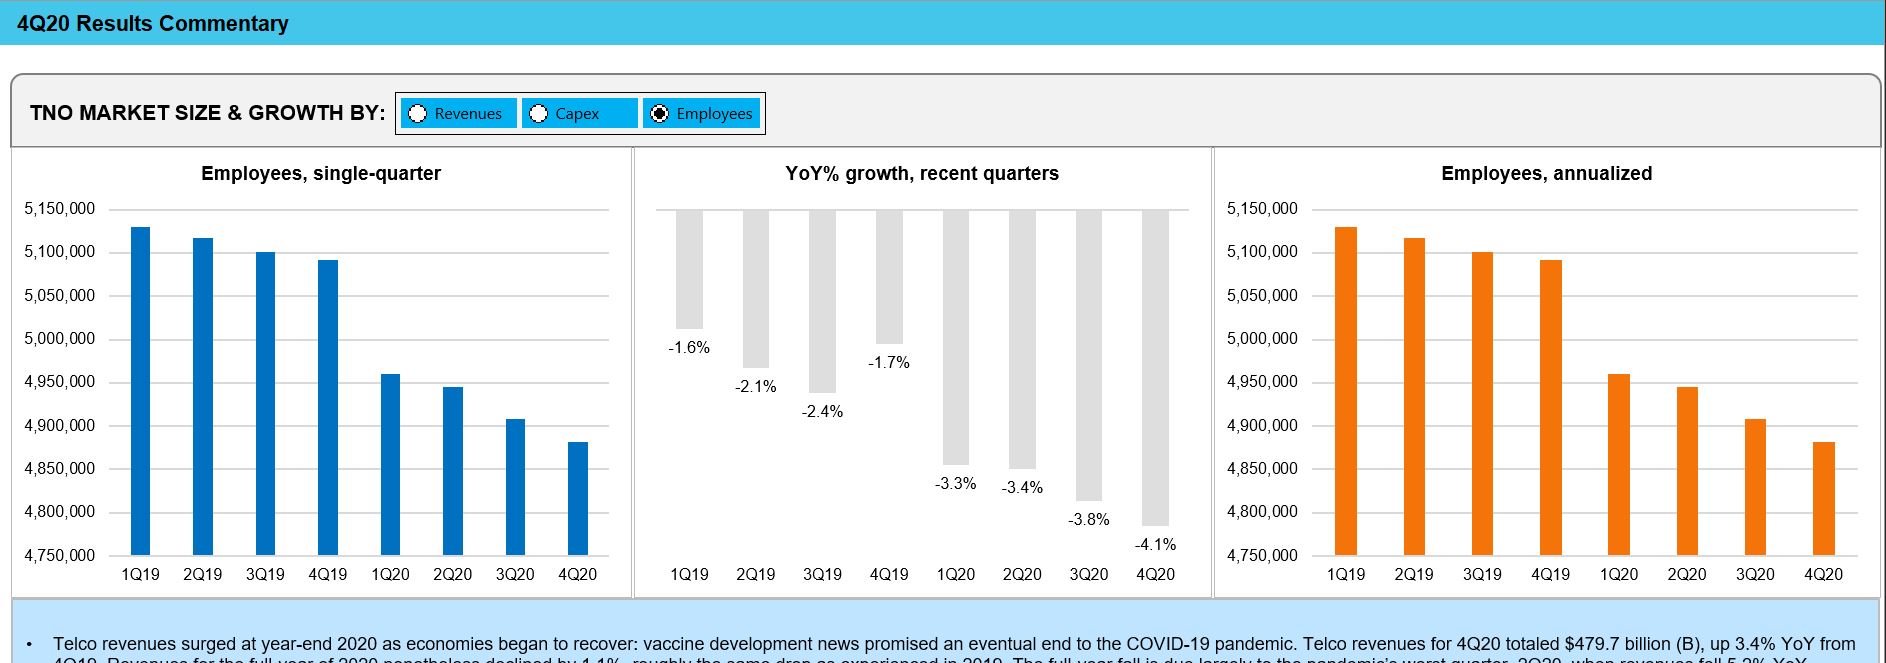
Industry headcount falls by 209K in 2020
Telco headcount took a noticeable dip last year, falling from 5.09 million employees in 2019 to 4.88M at year-end 2020. India’s two state-run operators, BSNL and MTNL, were the largest contributors as long-anticipated voluntary retirements finally took effect: the two telcos cut ~97K staff in 2020. However, this is a broader trend driven by the need to improve operational efficiency. Other telcos reducing headcount in 2020 include: China Mobile (down 32.5K) AT&T (-17.8K), Comcast (-6K), America Movil (-4.7K), Orange (-4.6K), and Telefonica (-4.1K). As telcos slim their workforces, they are investing in automation solutions across their operations, from network to sales and support.
Europe was a highlight on both a revenue and capex basis in 4Q20
Regionally, Asia and Europe were the bright spots in 4Q20, both growing revenues nicely from 4Q19. MEA and the Americas fell YoY. In capex terms, Europe was the only region to grow capex on a YoY basis in 4Q20. Europe’s 2020 capex was more backend loaded than usual, due to delayed spectrum auctions and the harsh economic dislocation from COVID earlier in the year.
Costs and profitability impacted by changes to sales & marketing, and adoption of automation
Telco opex declined in 2020, whether or not depreciation and amortization is included. The most interesting opex metric, Opex excluding D&A, totaled $1.17 trillion in 2020, from $1.22 trillion in 2019. Telcos undertook many measures that contributed to 2020’s opex reduction including shutting offices, moving sales and support functions online, automating a wide range of processes, and seeking out savings in network leasing & interconnect costs.
Telco profit margins continue to defy the declining revenue trend. For the industry as a whole, annualized EBITDA margin rose to 34.6% in 4Q20, from 34.1% in 3Q20 and 32.8% a year earlier. This is not only about EBITDA margins, as EBIT (operating) margins also have risen in the last few quarters, and ended 2020 at 15.2%, up 1.3 percentage points from 4Q19. Revenues are falling, but costs are falling faster. Among the bigger telcos achieving improvements in EBITDA margin in 2020 are: Bharti Airtel (from 39.1% in 2019 to 44.3% in 2020), Oi (from 15.2% to 34.1%), Telecom Egypt (from 22.0% to 34.7%), Telecom Italia (36.2% to 42.5%), Telenor (32.3% to 47.7%), Telstra (24.5% to 33.0%), and Vodafone (38.9% to 52.9%).
Reduced labor costs are not the direct cause of this margin growth, as industry labor costs actually increased as a percentage of opex in 2020. Rather, telcos have been implementing a number of programs aimed at improved operational efficiency, relating to both sales & marketing and the network. Digitizing the sales and customer support process began before COVID, but the pandemic gave telcos an excuse to become even more hands-off in this regard. The network is also extremely important. Network and IT operations can account for well over 20% of opex (ex-D&A), and the network/IT department is where the telco makes and delivers its products. Managing network/IT costs, and keeping the network performing at its highest level of reliability and resilience, is the only way a telco can stay in business and grow profitability. As telco execs aim for more automated networks, automation will be a key selling point for vendor solutions.
- Table Of Contents
- Figure & Charts
- Coverage
- Visuals
Table Of Contents
- Abstract
- Market snapshot
- Analysis
- Key stats through 4Q20
- Operator rankings
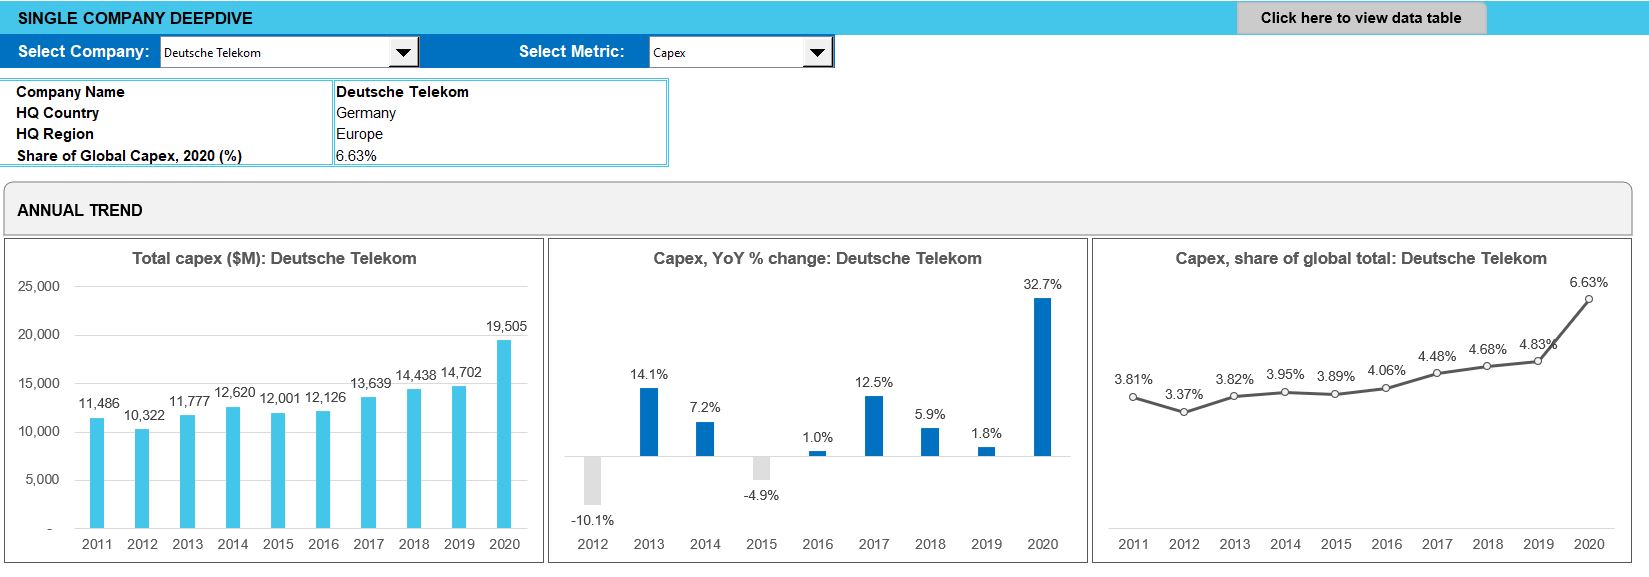
- Company Deepdive & Benchmarking
- Country breakouts
- Regional breakouts
- Raw Data
- Subs & traffic
- Exchange rates
- Methodology & Scope
- About
Figure & Charts
- TNO market size & growth by: Revenues, Capex, Employees – 1Q19-4Q20
- Regional trends by: Revenues, Capex – 4Q16-4Q20
- Opex & Cost trends
- Labor cost trends: 1Q19-4Q20
- Profitability margin trends: 1Q19-4Q20
- Spending (opex, labor costs, capex): annual and quarterly trend
- Key ratios: annual and quarterly trend
- Workforce & productivity trends: 1Q14-4Q20
- Operator rankings by revenue and capex: latest single-quarter and annualized periods
- Top 20 TNOs by capital intensity: latest single-quarter and annualized periods
- Top 20 TNOs by employee base: latest single-quarter
- TNOs: YoY growth in single quarter revenues
- TNOs: Annualized capital intensity, 2Q15-4Q20
- TNOs: Revenue and RPE, annualized 2Q15-4Q20
- TNOs: Capex and capital intensity (annualized), 2Q15-4Q20
- TNOs: Total headcount trends, 2Q15-4Q20
- TNOs: Revenue and RPE trends, 2011-20
- TNOs: Capex and capital intensity, 2011-20 ($ Mn)
- TNOs: Capex and capital intensity, 2Q15-4Q20 ($ Mn)
- TNOs: Revenue and RPE trends, 2Q15-4Q20
- Top 50 TNOs by total opex, 4Q20
- Top 50 TNOs by labor costs, 4Q20
- TNOs: Software as % of total capex
- TNOs: Software & spectrum spend
- TNOs: Total M&A, spectrum and capex (excl. spectrum)
- Top 50 TNOs by total debt: 2011-20
- Top 50 TNOs by total net debt: 2011-20
- Top 50 TNOs by long term debt: 2011-20
- Top 50 TNOs by short term debt: 2011-20
- Top 50 TNOs by total cash and short term investments ($M): 2011-20
Coverage
Operator coverage:
| A1 Telekom Austria | Advanced Info Service (AIS) | Airtel | Altice Europe | Altice USA | America Movil | AT&T | Axiata | Axtel | Batelco |
| BCE | Bezeq Israel | Bouygues Telecom | BSNL | BT | Cable ONE, Inc. | Cablevision | Cell C | Cellcom Israel | CenturyLink |
| Cequel Communications | Charter Communications | China Broadcasting Network | China Mobile | China Telecom | China Unicom | Chunghwa Telecom | Cincinatti Bell | CK Hutchison | Clearwire |
| Cogeco | Com Hem Holding AB | Comcast | Consolidated Communications | Cyfrowy Polsat | DEN Networks Limited | Deutsche Telekom | Digi Communications | DirecTV | Dish Network |
| Dish TV India Limited | DNA Ltd. | Du | EE | Elisa | Entel | Etisalat | Fairpoint Communications | Far EasTone Telecommunications Co., Ltd. | Frontier Communications |
| Globe Telecom | Grupo Clarin | Grupo Televisa | Hathway Cable & Datacom Limited | Idea Cellular Limited | Iliad SA | KDDI | KPN | KT | Leap Wireless |
| LG Uplus | Liberty Global | M1 | Manitoba Telecom Services | Maroc Telecom | Maxis Berhad | Megafon | MetroPCS Communications | Millicom | Mobile Telesystems |
| MTN Group | MTNL | NTT | Oi | Omantel | Ono | Ooredoo | Orange | PCCW | PLDT |
| Proximus | Quebecor Telecommunications | Rakuten | Reliance Communications Limited | Reliance Jio | Rogers | Rostelecom | Safaricom Limited | Sasktel | Shaw |
| Singtel | SITI Networks Limited | SK Telecom | Sky plc | SmarTone | SoftBank | Spark New Zealand Limited | Sprint | StarHub | STC (Saudi Telecom) |
| SureWest Communications | Swisscom | Taiwan Mobile | Tata Communications | Tata Teleservices | TDC | TDS | Tele2 AB | Telecom Argentina | Telecom Egypt |
| Telecom Italia | Telefonica | Telekom Malaysia Berhad | Telenor | Telia | Telkom Indonesia | Telkom SA | Telstra | Telus | Thaicom |
| Time Warner | Time Warner Cable | TPG Telecom Limited | True Corp | Turk Telekom | Turkcell | Veon | Verizon | Virgin Media | Vivendi |
| Vodafone | Vodafone Idea Limited | VodafoneZiggo | Wind Tre | Windstream | Zain | Zain KSA | Ziggo |
Regional coverage:
| Asia | Americas | Europe | MEA |
Visuals