By Matt Walker
This brief report presents data aimed at shedding light on the following question: can telcos afford to pay for their future investment needs? The report considers debt, cash, and margin metrics, for the industry overall and for specific key players. It also speculates how 2022 trends may impact 2023 and beyond, in a rising interest rate climate. A number of large telcos have high debt, low margins, and/or weak top line growth, and may have to curtail spending in 2023-4 in order to cope with this reality.
Key findings include:
-
- Total telco debt in 4Q22 was $1.14 trillion, 17% due in next year
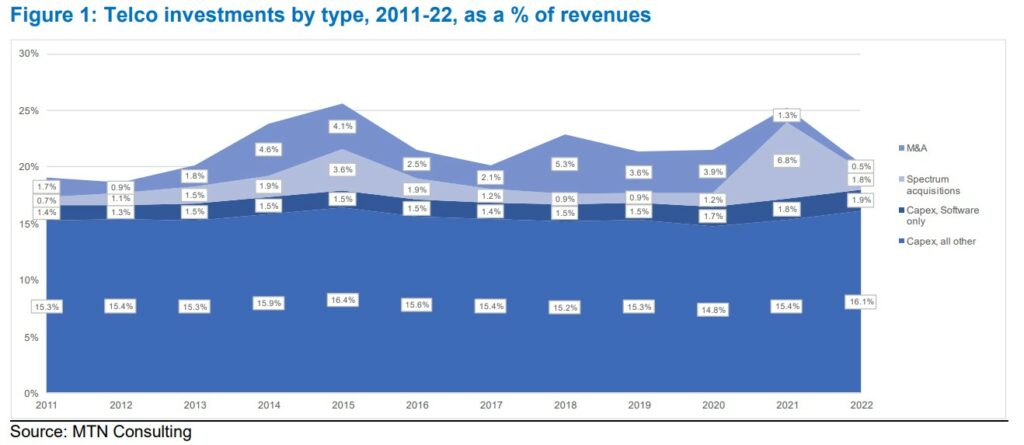
- Software capex as a % of revenues was 1.9% in 2022, up a bit from 1.8% in 2021.
- Spending on acquisitions amounted to 0.5% of revenues in 2022, the lowest figure since 2012.
- At the industry level, the ratio of net debt to EBITDA in 2022 was 1.9, a bit up from 2021 but down from 2020.
- A number of large telcos face short-term debt levels over 30% of total debt
- Average margins for the industry in 2022 disappointed: free cash flow margin for the telco industry in 2022 was 11.4%, down from 12.6% in 2021; EBITDA margin was 33.7% (2021: 34.0%), and EBIT margin was 14.4% (2021: 14.9%).
- Table Of Contents
- Figures and Tables
- Coverage
- Visuals
Table Of Contents
- Summary – page 2
- Telcos have spent big on capex, spectrum and M&A in last 2 years – page 2
- Total telco debt in 4Q22 was $1.14 trillion, 17% due in next year – page 3
- Net debt declined in 2022 but ratio to EBITDA in line with 2015-19 – page 4
- Many individual telcos have debt levels which will constrain their spending – page 5
- Margins, debt, and implications for spending outlook – page 6
- Appendix – page 8
Figures and Tables
Figure 1: Telco investments by type, 2011-22, as a % of revenues
Figure 2: Telco sector total debt in US$B, and short-term debt as % total
Figure 3: Components of telco sector total debt at year-end 2022 (US$B)*
Figure 4: Telco industry net debt ($M) and net debt to EBITDA ratio, 2011-22
Figure 5: Telcos with net debt to EBITDA ratios above 3 (YE2022)**
Coverage
Companies mentioned:
Airtel
Alphabet
Altice Europe
Amazon
America Movil
AT&T
Axiata
BCE
Bouygues Telecom
BSNL
BT
Cellnex
Charter Communications
China Telecom
China Unicom
Chunghwa Telecom
CK Hutchison
Comcast
Deutsche Telekom
Etisalat
Iliad SA
KDDI
KT
LG Uplus
Microsoft
Millicom
NTT
Oi
Omantel
Orange
PCCW
PLDT
Quebecor
Rogers
Shaw
Singtel
SK Telecom
SoftBank
Sprint
Starhub
Telecom Italia
Telefonica
Telia
Telkom Indonesia
Telstra
Telus
True Corp
Verizon
Vodafone
Visuals