By Matt Walker
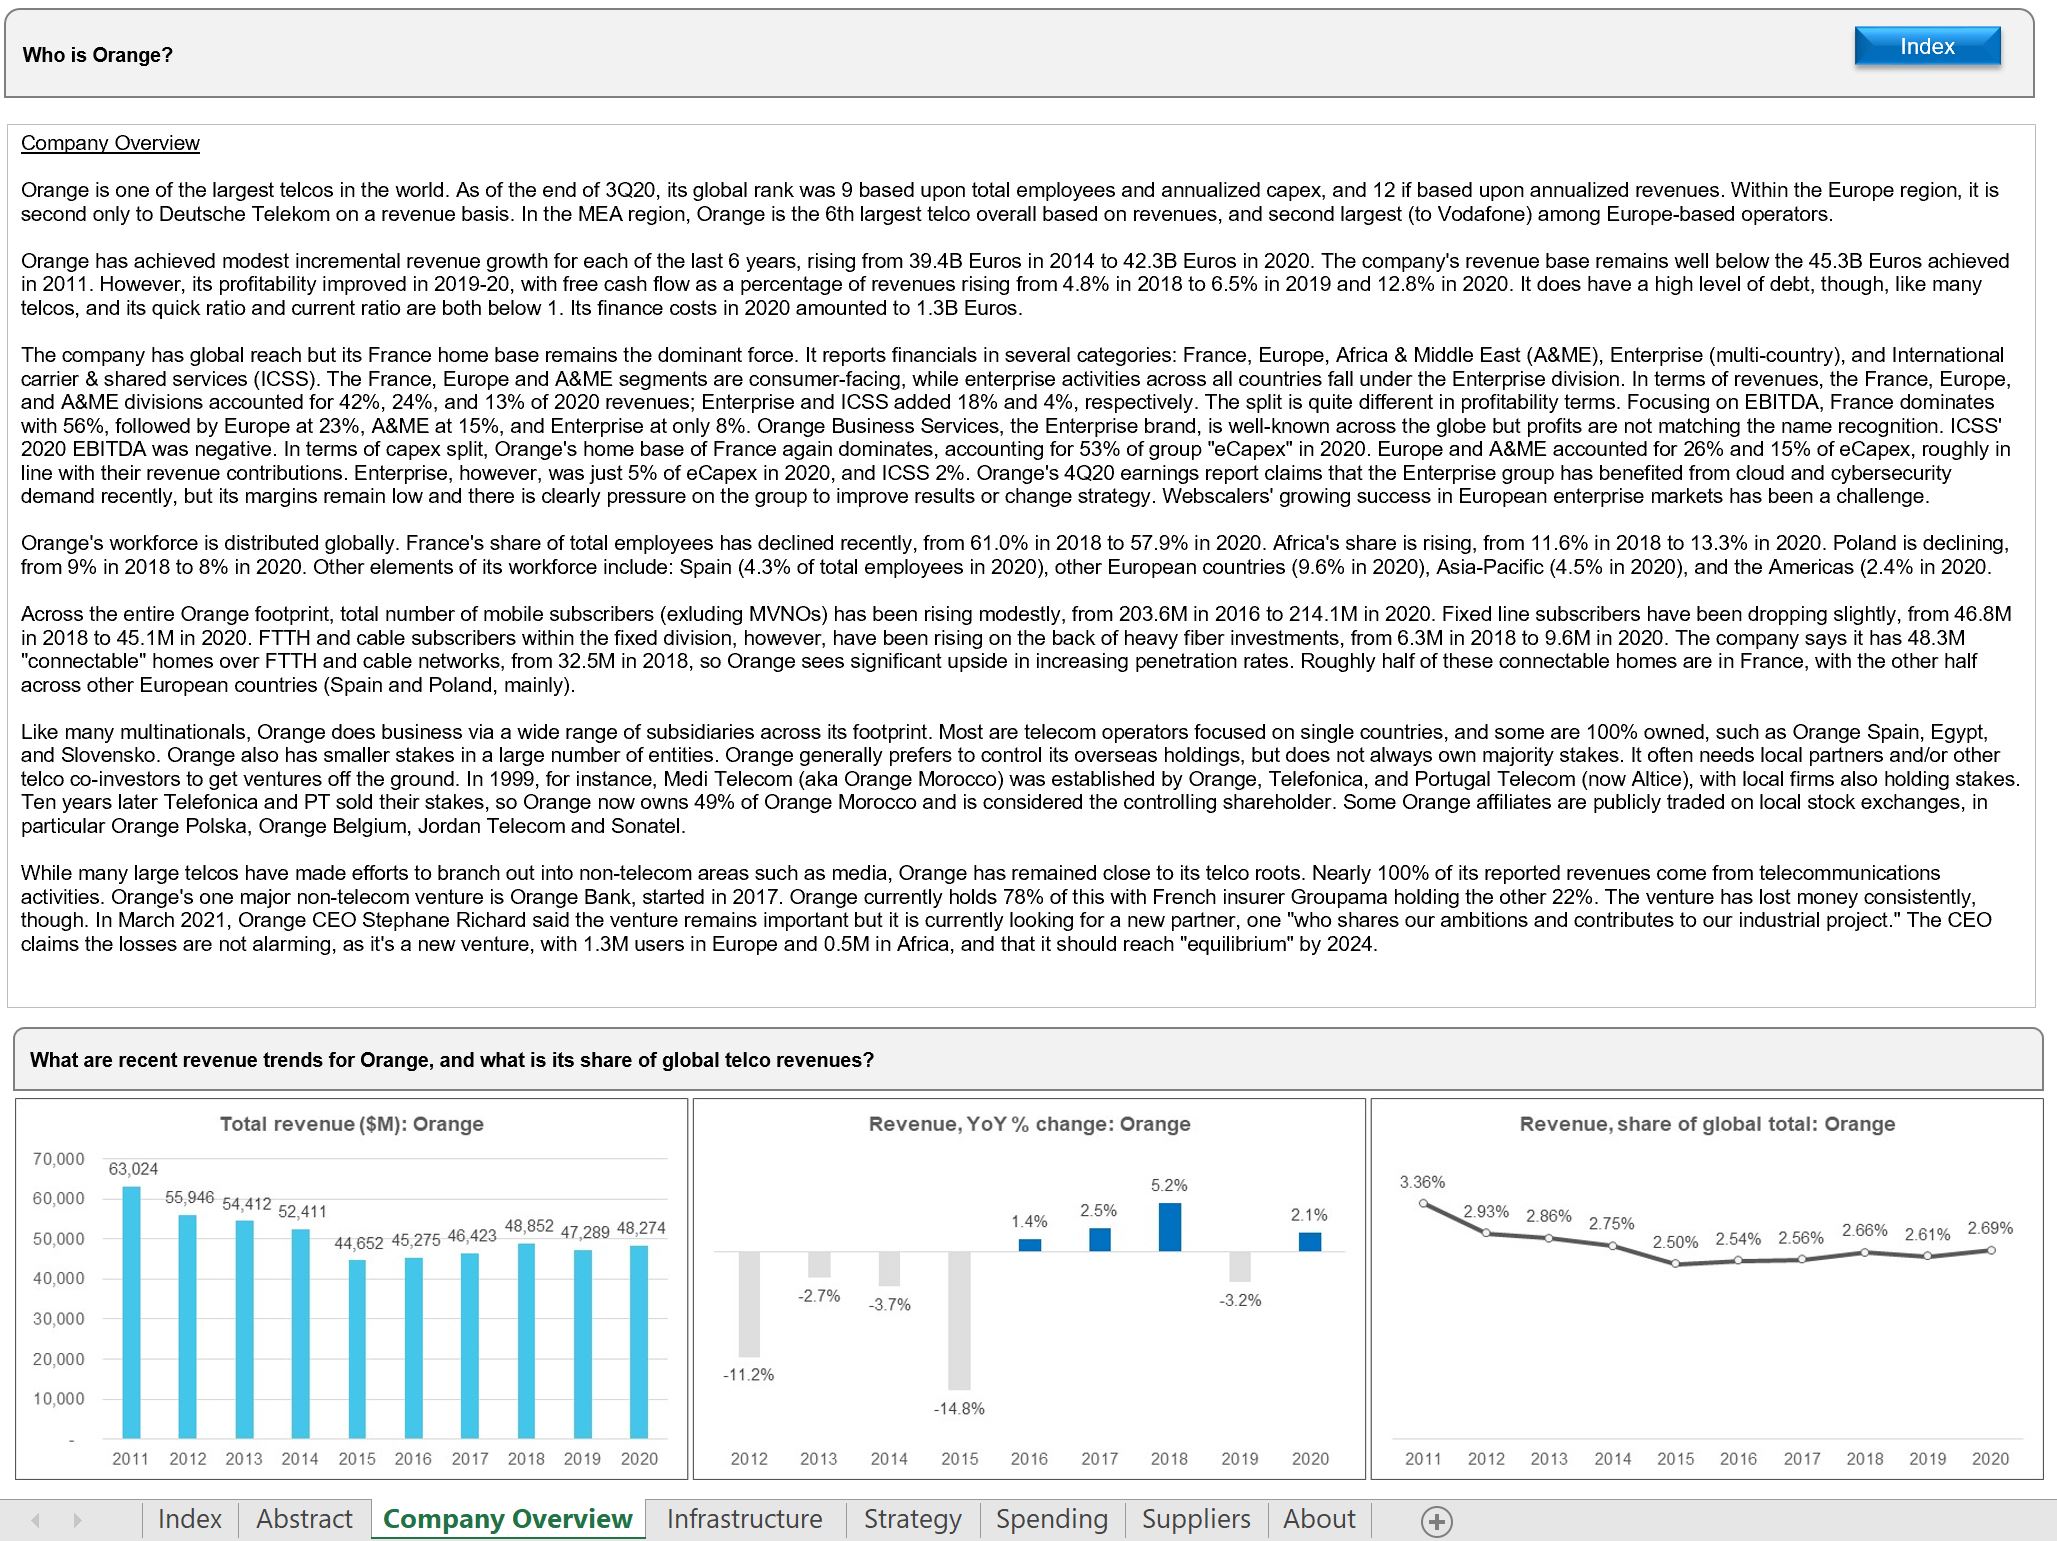
Orange is one of the largest telcos in the world. As of the end of 3Q20, its global rank was 9 based upon total employees and annualized capex, and 12 if based upon annualized revenues. Within the Europe region, it is second only to Deutsche Telekom on a revenue basis. In the MEA region, Orange is the 6th largest telco overall based on revenues, and second largest (to Vodafone) among Europe-based operators.
Orange has achieved modest incremental revenue growth for each of the last 6 years, rising from 39.4B Euros in 2014 to 42.3B Euros in 2020. The company’s revenue base remains well below the 45.3B Euros achieved in 2011. However, its profitability improved in 2019-20, with free cash flow as a percentage of revenues rising from 4.8% in 2018 to 6.5% in 2019 and 12.8% in 2020. It does have a high level of debt, though, like many telcos, and its quick ratio and current ratio are both below 1.
While many large telcos have made efforts to branch out into non-telecom areas such as media, Orange has remained close to its telco roots. Nearly 100% of its reported revenues come from telecommunications activities. Orange’s one major non-telecom venture is Orange Bank, started in 2017.
Across the entire Orange footprint, total number of mobile subscribers (exluding MVNOs) has been rising modestly, from 203.6M in 2016 to 214.1M in 2020. Fixed line subscribers have been dropping slightly, from 46.8M in 2018 to 45.1M in 2020. FTTH and cable subscribers within the fixed division, however, have been rising on the back of heavy fiber investments, from 6.3M in 2018 to 9.6M in 2020. The company says it has 48.3M “connectable” homes over FTTH and cable networks, from 32.5M in 2018, so Orange sees significant upside in increasing penetration rates. Roughly half of these connectable homes are in France, with the other half across other European countries (Spain and Poland, mainly).
Network infrastructure
Orange has a large network scattered across multiple countries and operating entities. That includes an incumbent network in France (Orange France), subsidiaries with incumbent origins overseas (e.g. Orange Polska), and subsidiaries with roots as competitive mobile operators (e.g. Orange Egypt). Orange also has substantial subsea network assets. Overall, about 43% of its net PP&E value comes from the wireline access network, which has grown its share recently as Orange has picked up investments in FTTH and searched for capex savings in the RAN via tactics like RAN sharing. Other net PP&E categories include wireless access (19.4% of net PP&E at end of 2020), core & transmission (10.8%), terminals & CPE (3.9%), software (12.9%), land & buildings (6.0% and falling), IT equipment (2.4%), and other (1.3%).
Network spending
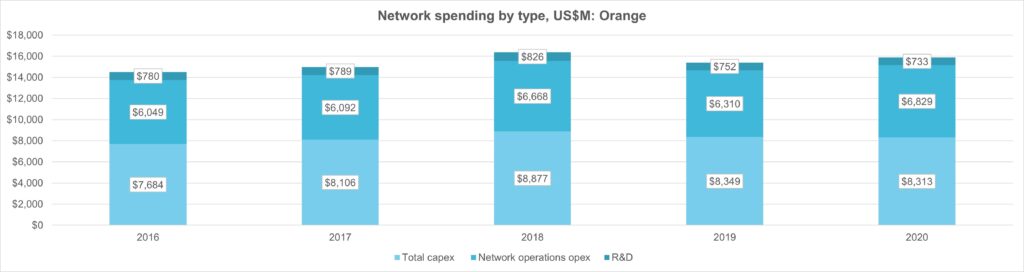
In 2020, Orange’s spending on network infrastructure included the following:
–>Total Capex: $8.31B, or 17.2% of revenues (2019: 17.7%). By region, Orange’s capex in 2020 was 56% France, 12% Spain, and 12% Africa & MEA; the remaining ~20% is scattered across Europe. Software, included in “Total Capex”, amounted to roughly 12% of capex in 2020. Spectrum would add 13.3% to Orange’s 2020 capex if it was included.
–>Network operations opex: $6.83B, or 21.2% of opex excluding D&A. This is an increase from 20.1% in 2019 and 19.3% in 2018. Orange is clearly interested in optimizing this expense category. An important aspect of its current focus on data/AI is the creation of “smarter networks” and improved operational efficiency in network operations. The “Internal labor expenses” portion of network operations expense has been declining with time, from 62% in 2016 to 54% in 2020, as Orange has come to rely more on external partners. This shift is likely to continue.
Note that our calculations assume that energy costs, not included in the network operations category, represent a steady 4.5% of opex ex-D&A.
–>R&D: $733M. As of year-end 2020, the company claims that it has a cumulative total of 8,770 patents either approved or pending, from 6,857 in 2018.
Suppliers
Growing and managing its network efficently is one of Orange’s main challenges. Orange allows its regional subsidiaries a high degree of autonomy in executing network decisions, and technology selection patterns vary across its footprint. However, It attempts to do some things centrally, leveraging central procurement, testing and R&D resources of the parent company. In addition, Orange and DT created a joint procurement entity known as BuyIn in 2011. BuyIn is more about information sharing than joint procurement, however. Orange is the decision-maker when it comes to awarding contracts.
Orange has many suppliers across its network, in line with the scope of its operations and mix of different facility and service types. Huawei, Ericsson, and Nokia have been the largest suppliers over the last 3 years, in line with their strength in mobile RAN markets. Huawei and Nokia are the top two vendors in access and transmission markets. Cisco is an important supplier in IP infrastructure. Other important suppliers include Adtran (fixed access) Amdocs (OSS/BSS), Dell Technologies/VMWare (virtualization, cloud solutions), Infinera (transmission), Juniper (IP infra), and NEC (microwave).
Over the last decade, Huawei was likely the largest individual vendor to Orange due to its success winning 4G network buildouts. For 5G, however, Orange operating companies have largely shied away from the Chinese company; Orange Spain is an exception.
- Table Of Contents
- Charts
- Coverage
- Visuals
Table Of Contents
- Abstract
- Company Overview
- Network Infrastructure
- Network Strategy
- Network Spending
- Network Suppliers
- About
Charts
- Total revenue ($M): Orange
- Revenue, YoY % change: Orange
- Revenue, share of global total: Orange
- Total capex ($M): Orange
- Capex, YoY % change: Orange
- Capex, share of global total: Orange
- Total employees: Orange
- Employees, YoY % change: Orange
- Employees, share of global total: Orange
- Orange: FCF/revenues
- Orange: Net debt ($M)
- Orange: Capital intensity (%)
- Orange: Labor costs % of opex (excl D&A)
- Orange: Revenue by region, 2020
- Orange: Capex by region, 2020
- Total revenue: Annualized, Orange vs. Other European telcos
- Total capex: Annualized, Orange vs. Other European telcos
- Total employees: Annualized, Orange vs. Other European telcos
- Revenue per employee: Annualized, Orange vs. Other European telcos
- Annualized EBIT margin (%): Orange vs. top regional telcos and regional average
- FCF/Revenues: Orange vs. top regional telcos and regional average
- Capital intensity: Orange vs. top regional telcos and regional average
- Labor costs/Opex ex-D&A: Orange vs. top regional telcos and regional average
- Labor costs per employee, annualized: Orange vs. top regional telcos and regional average
- Orange: Net PP&E by category of plant
- Network spending by type, US$M: Orange
- Network operations opex, Orange: total by type and % of Opex ex-D&A
- Orange capex by country/region, 2018-20 (% total)
- Capex breakdown (Software v. All other) and Spectrum addition to total capex
- Orange: Major vendors and scope of relationship
Coverage
Companies and organizations mentioned in this report include the following:
Adtran
Akamai
Amazon Web Services
Amdocs
Basefarm
BT
Ceragon Networks
Ciena
Cisco Systems
Dell Technologies
Deutsche Telekom
Engie
Ericsson
Fujitsu
Google Cloud Platform
HPE
Huawei
IBM
Infinera
Juniper Networks
KPN
Microsoft Azure
NEC Corporation
Nokia
NuRAN
Open Compute Project
Parallel Wireless
Riverbed
Swisscom
Telecom Infrastructure Project
Telecom Italia
Telefonica
Total
VMWare (Dell Technologies)
Vodafone
ZTE
Visuals