By Matt Walker
Comcast Corporation is a global media and communications conglomerate with two divisions offering telecommunications services based upon a cable TV-centric network infrastructure. The two units combined rank 6 among all telcos globally based upon 3Q20 annualized revenues, and 12th if ranked by capex. Comcast is the largest cable TV company worldwide, comfortably larger than second ranked Charter Communications, also based in the US.
For the parent company, Comcast Corp recorded 2020 revenues of $103.6B. Comcast’s US cable arm, Comcast Cable Communications, accounted for $60.1B or 58% of revenues, while the European cable unit Sky recorded revenues of $18.6B or 18% of revenues. Comcast’s traditional media arm, NBCUniversal, accounted for the remaining revenues. On a profitability basis, Comcast Cable Communications dominates, accounting for an average of well over 70% of group EBITDA over the 2018-20 period. The US cable unit’s share of group capex is also outsized.
Network infrastructure
Comcast Cable US is a cable TV-centric telco, with a large fiber network in the core and a hybrid of fiber and coaxial cable (HFC) network near customer locations. In the last decade, Comcast has invested heavily to upgrade the capacity and functionality of this network, pushing fiber further to the edge and deploying faster access technologies (notably DOCSIS 3.1). Its broadband service speeds continue to get higher, requiring heavy investments in core capacity; Comcast claims that it doubles its network capacity in roughly 2.5 years. One example: it had 1700 100Gbps links to its core network in place in June 2020, from 500 100G links in March 2019.
Comcast’s European unit, Sky, has a far different network. Its initial offering was a one-way satellite broadcast service. Over the last two decades, the company has gradually found ways to layer broadband Internet connectivity on top of this via a combination of fiber deployments, acquisitions, and local loop unbundling.
Network spending
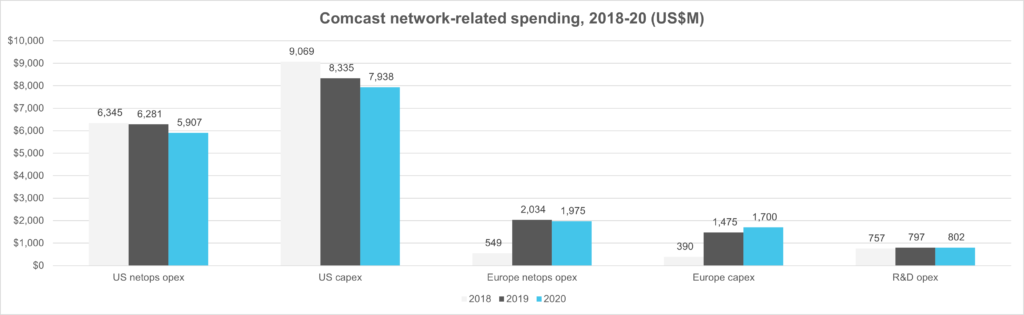
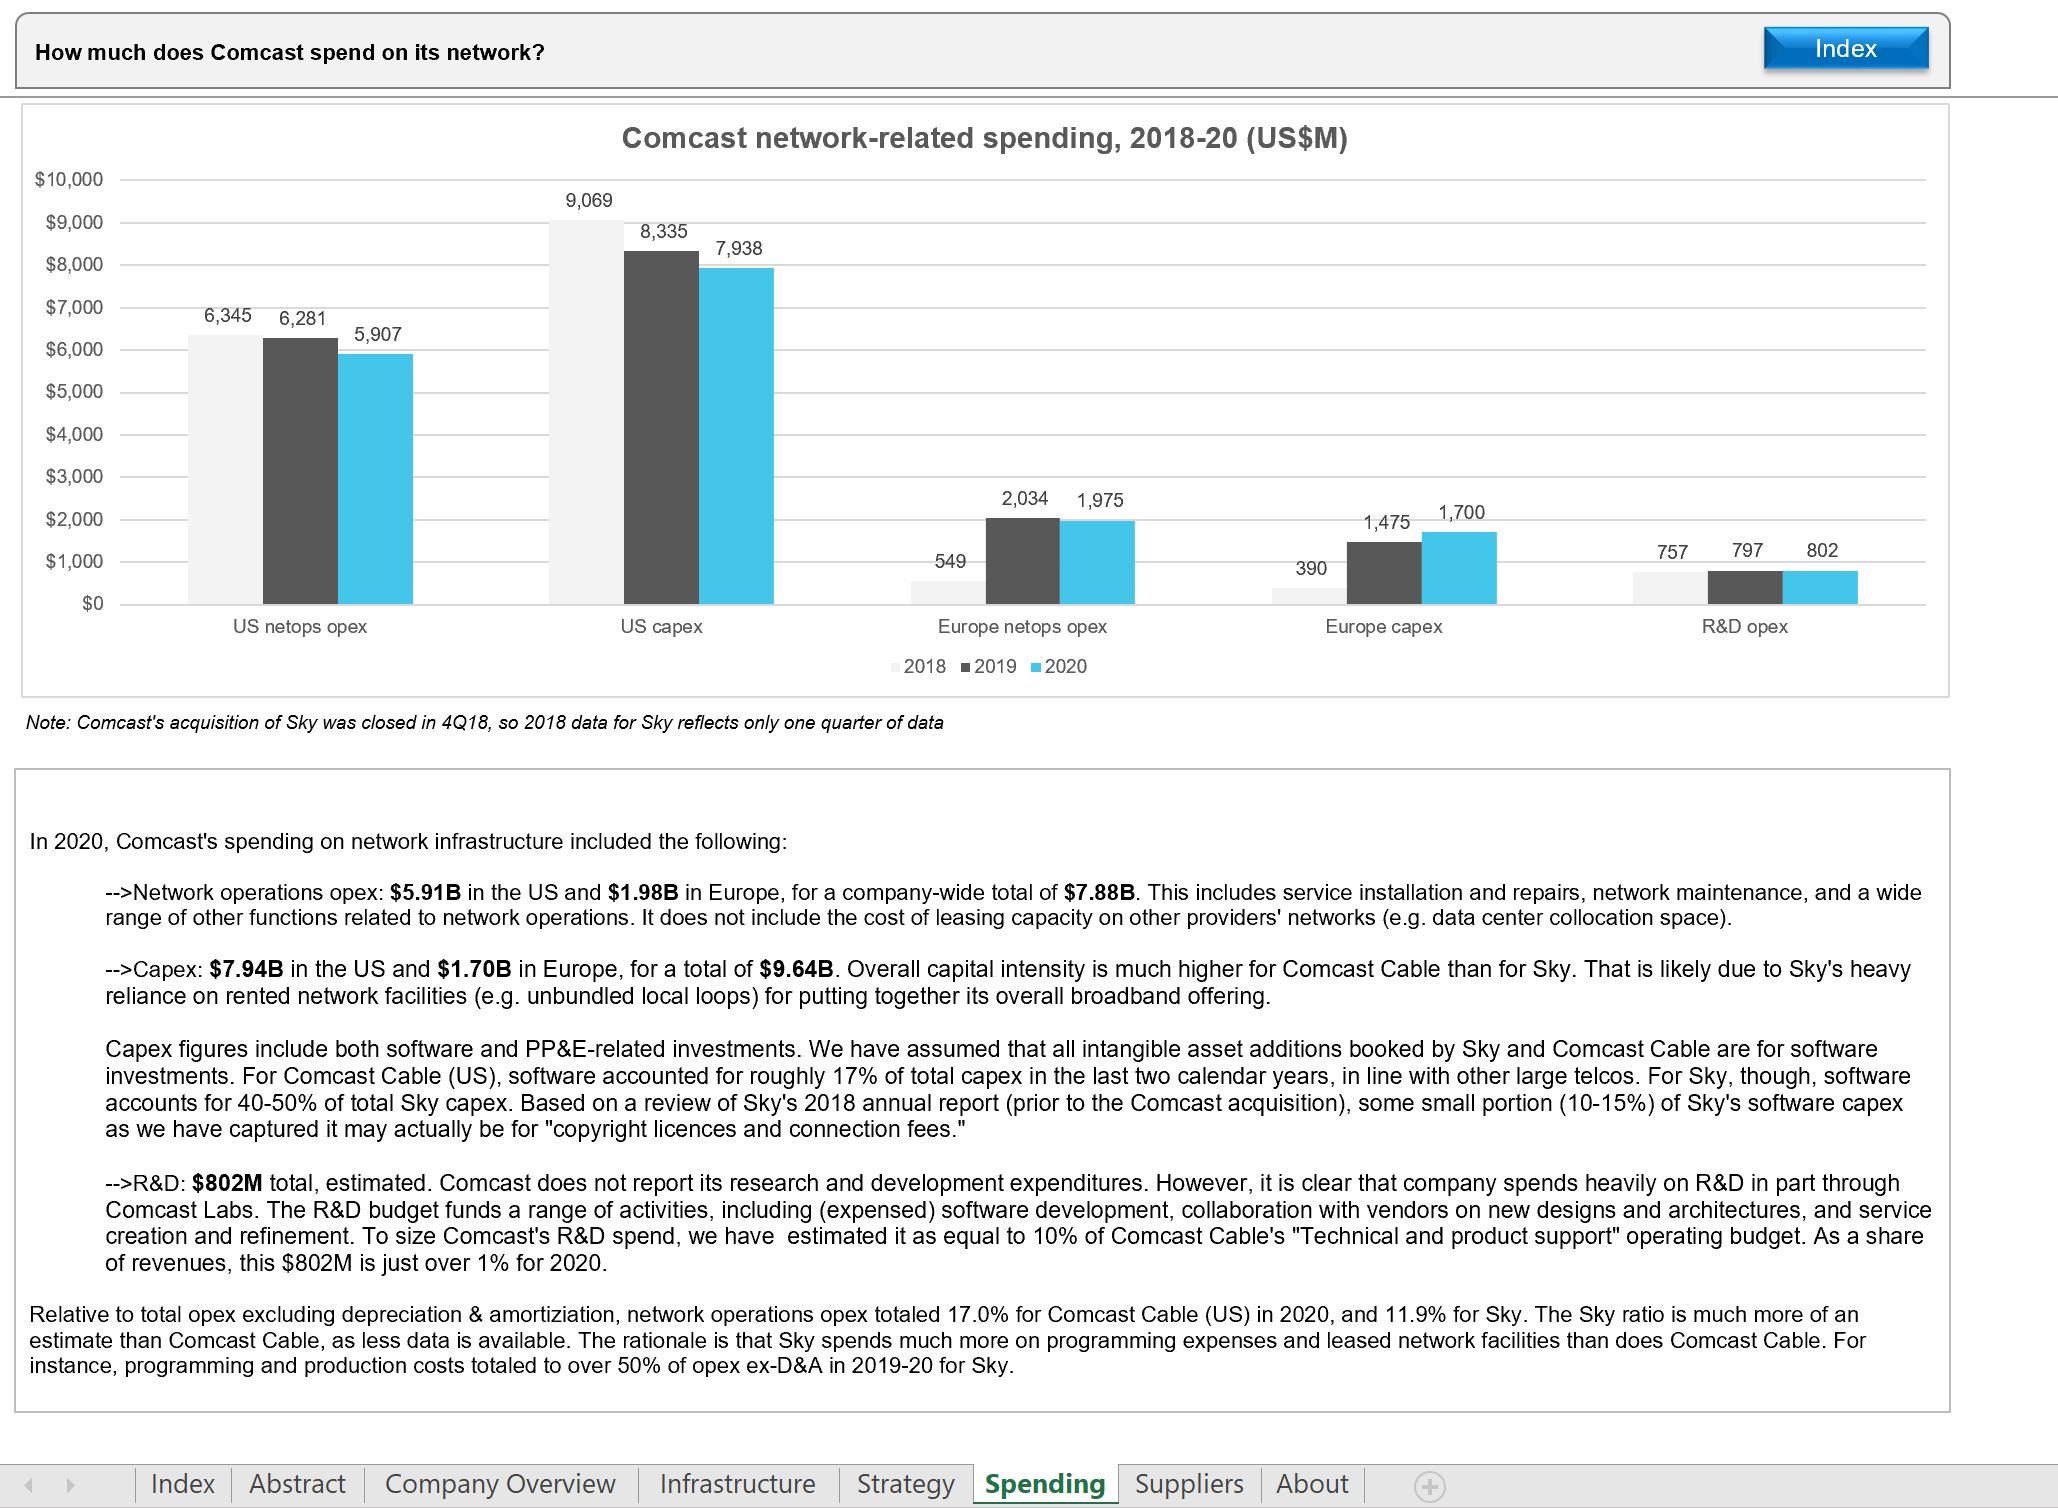
In 2020, Comcast’s spending on network infrastructure included the following:
–>Network operations opex: $5.91B in the US and $1.98B in Europe, for a company-wide total of $7.88B. This includes service installation and repairs, network maintenance, and a wide range of other functions related to network operations.
–>Capex: $7.94B in the US and $1.70B in Europe, for a total of $9.64B. Overall capital intensity is much higher for Comcast Cable than for Sky. That is likely due to Sky’s heavy reliance on rented network facilities (e.g. unbundled local loops) for putting together its overall broadband offering.
–>R&D: $802M total, estimated. Comcast does not report its research and development expenditures.
Suppliers
Comcast’s single largest supplier is CommScope. One reason is the X1 manufacturing relationship, overseen by CommScope’s CPE group, but Comcast buys from CommScope’s Connectivity and N&C units as well. In 2019, Comcast accounted for 13% of CommScope’s sales, or a total of just under $1.1 billion.
Other important suppliers to Comcast in the network include Amdocs, Ciena, Cisco, CSG, Harmonic, Intel, and Technicolor. Ciena is especially important in the optical transport domain.
On the network rollout and maintenance side, CommScope works closely with both Mastec and Dycom, along with other contractors. Comcast is usually 5-7% of revenues for Mastec; if 5%, that would imply roughly $360M in 2019 spending based on Mastec’s annual revenues of $7.2B. For Dycom, Comcast is even more significant, accounting for roughly $500M of Dycom’s total 2019 revenues (15.1% of $3.34B).
- Table Of Contents
- Charts
- Coverage
- Visuals
Table Of Contents
- Abstract
- Company Overview
- Network Infrastructure
- Network Strategy
- Network Spending
- Network Suppliers
- About
Charts
- Total revenue ($M): Comcast
- Revenue, YoY % change: Comcast
- Revenue, share of global total: Comcast
- Total capex ($M): Comcast
- Capex, YoY % change: Comcast
- Capex, share of global total: Comcast
- Comcast: Revenue by region, 2019
- Comcast: Capex by region, 2019
- Comcast: Annualized capital intensity versus other large operators
- Employees: Comcast
- Employees, YoY % change: Comcast
- Employees, share of global total: Comcast
- Revenue per employee, annualized: Comcast versus other large operators
- Comcast network-related spending, 2018-20 (US$M)
- Comcast cable communications-related capex, 2018-20 (US$M)
- Comcast cable capex: software as % of total
- Comcast US capex by category, % total
- Network operations as % of total opex ex-D&A
- Comcast: Annualized capex by country market (US$M)
- Comcast: Major vendors and scope of relationship
Coverage
Companies and organizations mentioned in this report include the following:
365 Data Centers
Amazon Web Services
Amdocs
Ciena
Cisco
CommScope
CoreSite Realty
Cox
CSG Systems
CUJO AI
Cyxtera
Digital Realty
EdgeConnex
Equinix
Harmonic
HPE/Aruba
IBM Cloud
Intel
Liberty Global
Metro Ethernet Forum
Microsoft Azure
Open Networking Foundation
Rogers
Shaw
Technicolor
Telefonica UK (O2)
Verizon
Videotron
Virgin Media
VMWare
Visuals