By Matt Walker
Automation is the key to telcos controlling their network engineering costs
The telecommunications industry as a whole has been in “running to stand still” mode for at least a decade. Limited top-line growth opportunities in core markets have created a constant concern with opportunities for cost reductions. Vendors have facilitated telecommunications network operators’ cost-reduction efforts with a constant stream of innovations, many aimed at automating tasks which used to require staff intervention.
That’s important because labor isn’t cheap. The funds spent on building and upgrading telecommunications network operator (telco) networks, represented by capital expenditures (capex), get a lot of industry attention. There should be just as much attention paid to technical labor costs and how to optimize this cost base. Global telco capex was $297 billion (B) in 2019. Telco labor costs amounted to $292 billion in the same year, or 23.1% of operating expenditures excluding depreciation & amortization (opex ex-D&A). Half of this figure is for technical staff: about 30% for line, radio and equipment installation and repair; and 20% for computer/IT/software development-related occupations.
Both systems vendors like Ericsson and Nokia and a plethora of independent software vendors (ISVs) are developing a broad range of automation tools for telcos, related to network design, planning, forecasting, testing, and repair. Many of the tools leverage recent advancements in artificial intelligence and machine learning. The tools require capex to purchase and staff training to implement, but also promise to reduce the headcount required to run networks.
Automation doesn’t mean people will become obsolete, but it does mean a changing workforce. Telcos require different skillsets in employees nowadays, with software development and database administration more important (and more costly) than laying fiber and climbing towers. As 5G networks scale, and telcos look to a broad range of new services to deliver growth (or at least to stem revenue erosion), automation will remain key to their success.
About this report
This report quantifies telco spending on labor costs, focusing on the telecom and IT network engineering workforce in particular. It assesses the implications of cost variations among different specialties in this labor pool, and the role of automation in networks. The report also highlights telcos that have done above average jobs at optimizing their labor base, and examines automation tools in use by these leaders and the broader industry.
- Table Of Contents
- Figure & Charts
- Coverage
- Visuals
Table Of Contents
- Summary – 3
- Automation is the key to telcos controlling their network engineering costs – 3
- What’s the current situation? – 4
- Telco labor costs are a major part of opex, averaging 23% of total worldwide – 4
- Key findings – 4
- Telco labor is relatively expensive, both on the management and technical sides – 5
- Up to half of total labor costs are technical in nature: maintenance and repair, network engineering, and software/IT – 5
- Labor cost burden as % total opex varies widely – 6
- Some telcos have optimized their workforce better than others in the search for profitability – 7
- Carrier-neutral providers now employ thousands of technicians installing and repairing lines, and radio and telecommunications equipment – 8
- How did we get here? – 9
- Headcount and labor costs per head are stable, but telcos work hard to keep it this way – 9
- Productivity has surged in the wireless business – 9
- Top performers are deploying automation across range of areas, with RAN a focal point – 10
- Headcount and labor costs per head are stable, but telcos work hard to keep it this way – 9
- What happens next? – 12
- RAN vendors and ISVs developing broad range of automation tools – 12
- Conclusions – 15
- Appendix 1 – 16
- About MTN Consulting
- Terms of Use
Figure & Charts
Figure 1: Telco revenues, capex, and labor costs (US$B) – 4
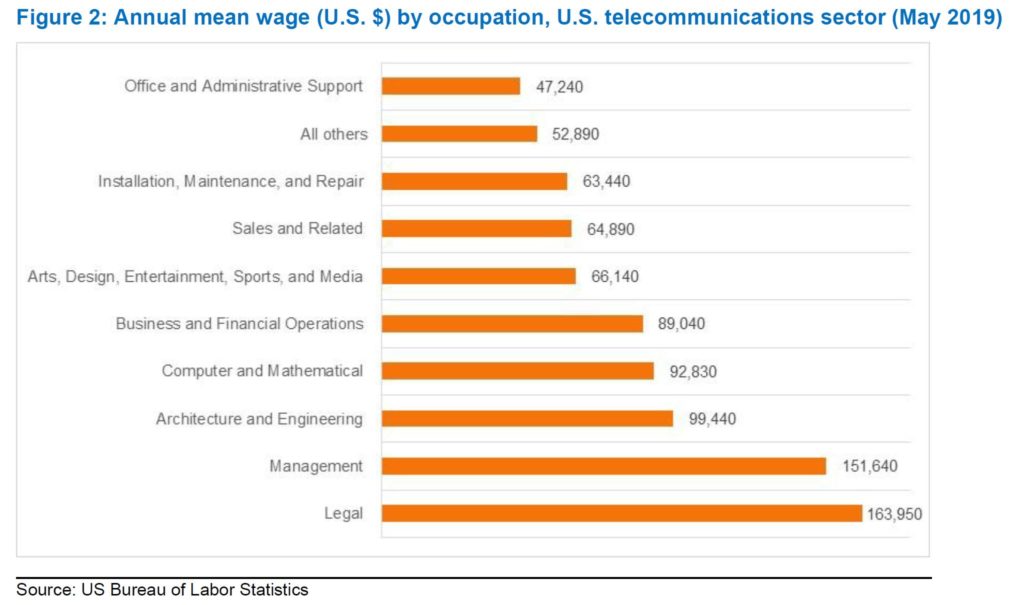
Figure 2: Annual mean wage (U.S. $) by occupation, U.S. telecommunications sector (May 2019) – 5
Figure 3: Technical occupations in the U.S. telecom industry: % of employment and wages (May 2019) – 6
Figure 4: Labor costs as a percentage of opex ex-D&A, global average (annualized) – 7
Figure 5: Earnings before tax & interest per $1 spent on staff (2019) – 8
Figure 6: Telecom industry headcount and average labor cost per employee ($K), 2011-19 – 9
Figure 7: Average annual percent change in productivity by industry, U.S. (2007-18) 10
Figure 8: Top performing telcos and automation – sample deployments – 11
Figure 9: Automation offerings from the vendor marketplace – 12
Coverage
Organizations mentioned in this report include:
| Accenture | Acumos | Airtel | AIS | Altice Europe | Altice Labs | America Movil | Aria Networks | AT&T | ATDI |
| Axiata | BCE | Cellwize | Charter Communications | China Mobile | China Unicom | Comarch | Crown Castle | Deutsche Telekom | Du |
| Ericsson | Etisalat | EXFO | Forsk | HERE | Huawei | IBM | iBwave | Infovista | KDDI |
| KT | MTN Group | Nokia | NTT | O-RAN Alliance | Orange | P.I. Works | Parallel wireless | RanPlan Wireless | Samsung |
| Tech Mahindra | Telefonica | Telenor | Telkom Indonesia | Telstra | TEOCO | U.S. Bureau of Labor Statistics | Verizon | Vodafone |
Visuals


