By Arun Menon
This market review provides a comprehensive assessment of the global telecommunications industry based on financial results through June 2021 (2Q21). The report tracks revenue, capex and employee for 138 individual telecommunications network operators (TNOs). For a sub-group of 50 large TNOs, the report also assesses labor cost, opex and operating profit trends. The report also covers annual data for other financial metrics such as debt, cash & short term investments, M&A spend and cash flow from operations for the TNO-50. Our coverage timeframe spans 1Q11-2Q21 (42 quarters). The report’s format is Excel.
ABSTRACT
2Q21 RESULTS SUMMARY
Double-digit spurt a first for telco revenues in at least a decade
The telecom network operator (telco) market witnessed something unprecedented in the latest quarter – for the single quarter 2Q21, telco revenues surged at a double-digit rate (12.2%) for the first time in at least a decade on a YoY basis, to post $478.4 billion (B). But this unusually high growth is due to a weak base in 2Q20, when revenues totaled $426.5B, the lowest ever during the 1Q11-2Q21 period. Also, as witnessed in 1Q21, the trend of currency appreciation against the US dollar in several key markets continued to play out in the latest quarter.
Telco market revenues are notably impacted by exchange rates. In a fixed exchange rate scenario, where all currency exchange rates are held constant to the 1Q11 value, YoY revenue growth has been much more stable in the telecom sector than when using actual rates. Using fixed rates, telco revenue growth would still have been an impressive 8.2% YoY in 2Q21, but down by 4 percentage points when compared to actual exchange rates.
Annualized revenues also grew for the second straight quarter, posting $1.88 trillion with a YoY growth rate of 5.5% in 2Q21. At the operator level, five of the top 20 best performing telcos by topline in 2Q21 posted double-digit growth on an annualized basis. These include Deutsche Telekom (30.6% YoY vs. annualized 2Q20), China Telecom (17.6%), China Mobile (17.3%), and China Unicom (14.1%). By the same criteria, the worst telco growth came from Softbank (-13.9%) during the same period. America Movil and Telefonica were only the two other operators among the top 20 to post a decline in revenues. While the big swings at Deutsche Telekom and Softbank are due to the former closing its acquisition of Sprint from Softbank in April 2020, growth witnessed by other operators was mostly an outcome of low base effect. Another factor for some operators is non-service revenues, as these have grown with 5G device sales in many markets.
Capex growth outpace revenue growth
The weak base effect also propelled capex at a much faster rate than revenues in the latest single quarter which stood at 15%, totaling $75.5B in 2Q21. But there is a hint of an uptick in investment by telcos as corroborated by a slight rise in annualized capital intensity of 16.4% in 2Q21 – it was on a downhill slide for seven straight quarters before this. With revenue recovery, telcos have resumed investments in infrastructure upgrades and 5G buildouts. For instance, Vodafone’s annualized capital intensity spiked from 15.4% in 2Q20 to 18.4% in 2Q21, as spending ramped both for meeting connectivity demands and new digital platforms.
The biggest capex spender in 2Q21 on a single quarter and annualized basis was China Mobile. This was despite the company’s YoY drops of 6.4% and 15.3% in the single quarter and annualized 2Q21 periods, respectively, enabled by CM’s network partnership with CBN. Nine out of the top 20 operators by annualized capex spend posted double-digit growth rates in the period ended 2Q21. Some of these include: Deutsche Telekom (52.1% YoY vs. annualized 2Q20), Vodafone (24.2%), Orange (17.6%), and BT (25.6%). On an annualized capital intensity basis, Rakuten beats all other telcos handily with a roughly 183% capex/revenue ratio for the quarter; its greenfield network rollout is reaching its peak. Other capital intensity standouts include: Globe Telecom (49.9%), PLDT (43.1%), Oi (41%), Telecom Egypt (34.1%), CK Hutchison (32.7%), True Corp (31.3%), and Digi Communications (31.2%).
Digital transformation and automation continue to drive profitability
Historically, telcos have maintained stable profitability margins – EBIT margins have been in the range of 13-17% while EBITDA margins have never gone down below 30% since 2011. This trend continues to stretch out into 2Q21. Annualized operating margins ended 2Q21 at 15%, up from 14% in the same quarter of prior year. Annualized EBITDA margins improved marginally, up from 33.4% in 2Q20 to 33.8% in 2Q21. Reduced employee costs through headcount reduction are not the direct cause of this margin growth. In fact, labor costs have been rising as a percentage of opex. To improve operational efficiency, telcos are resorting to several initiatives specifically aimed at digitizing the sales & marketing function. Amid the pandemic last year, telcos were forced to operate with minimal human intervention, and automation efforts have only accelerated since then. As telco execs aim for more automated networks to sustain and grow profitability, automation will be a key selling point for vendor solutions.
Industry headcount dip further despite rise in labor costs
Telco industry headcount continue to decline, falling to 4.838 million in 2Q21, down from 4.944 million a year ago. Telco spending on digital transformation, software-defined networks (SDN) and AI tools have facilitated a smaller workforce. MTN Consulting expects headcount reductions to continue via attrition and voluntary retirement schemes, heading towards 4.5 million by 2025. However, we also expect telcos to invest heavily in their workforce: retraining existing employees on digital platforms, and hiring highly skilled software savvy employees. The average telco employee salary will rise as a result, an outlook consistent with 2Q21 results – annualized labor costs per employee increased to $61.5K in 2Q21 from $57.8K in 2Q20.
Europe continues to be a bright spot on both revenue and capex basis in 2Q21
Regionally, all four major regions witnessed double-digit growth in revenues from 2Q20. But in capex terms, Europe was a standout as it managed to grow by 29.9% on a YoY basis in 2Q21. The region also recorded not just an uptick but also the highest annualized capital intensity of 18.4% in 2Q21, while all other regions witnessed a fall when compared to the same period last year. Europe’s capex growth story is courtesy of a late start to 5G spending due to delayed spectrum auctions, coupled with increased efforts in FTTH deployments and government-supported rural rollouts.
- Table Of Contents
- Figure & Charts
- Coverage
- Visuals
Table Of Contents
- Abstract
- Market snapshot
- Analysis
- Key stats through 2Q21
- Operator rankings
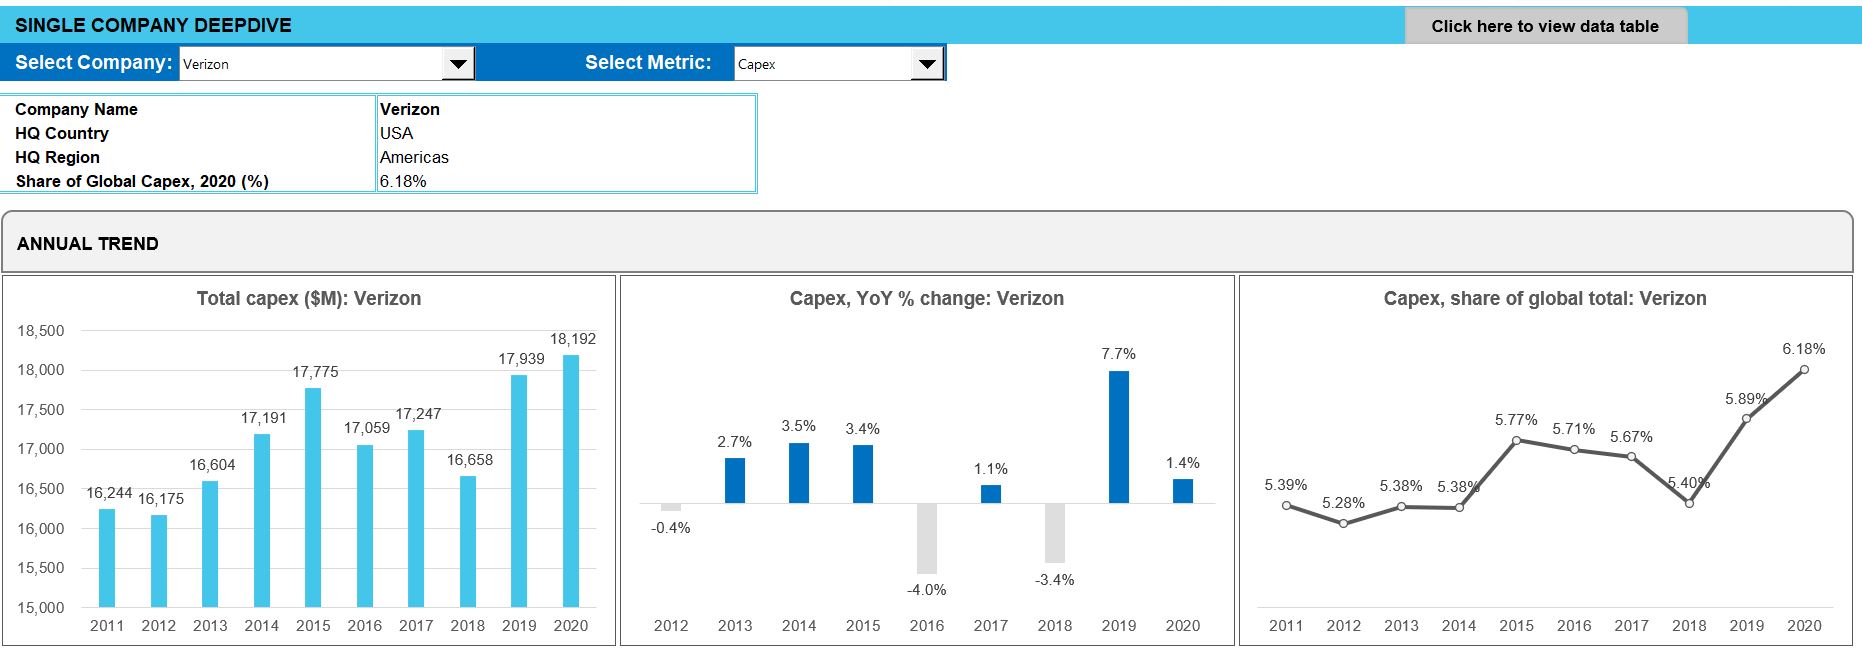
- Company Deepdive & Benchmarking
- Country breakouts
- Regional breakouts
- Raw Data
- Subs & traffic
- Exchange rates
- Methodology & Scope
- About
Figure & Charts
- TNO market size & growth by: Revenues, Capex, Employees – 2Q19-2Q21
- Regional trends by: Revenues, Capex – 2Q17-2Q21
- Opex & Cost trends
- Labor cost trends: 2Q19-2Q21
- Profitability margin trends: 2Q19-2Q21
- Spending (opex, labor costs, capex): annual and quarterly trend
- Key ratios: annual and quarterly trend
- Workforce & productivity trends: 1Q14-2Q21
- Operator rankings by revenue and capex: latest single-quarter and annualized periods
- Top 20 TNOs by capital intensity: latest single-quarter and annualized periods
- Top 20 TNOs by employee base: latest single-quarter
- TNOs: YoY growth in single quarter revenues
- TNOs: Annualized capital intensity, 2Q15-2Q21
- TNOs: Revenue and RPE, annualized 2Q15-2Q21
- TNOs: Capex and capital intensity (annualized), 2Q15-2Q21
- TNOs: Total headcount trends, 2Q15-2Q21
- TNOs: Revenue and RPE trends, 2011-20
- TNOs: Capex and capital intensity, 2011-20 ($ Mn)
- TNOs: Capex and capital intensity, 2Q15-2Q21 ($ Mn)
- TNOs: Revenue and RPE trends, 2Q15-2Q21
- Top 50 TNOs by total opex, 2Q21
- Top 50 TNOs by labor costs, 2Q21
- TNOs: Software as % of total capex
- TNOs: Software & spectrum spend
- TNOs: Total M&A, spectrum and capex (excl. spectrum)
- Top 50 TNOs by total debt: 2011-20
- Top 50 TNOs by total net debt: 2011-20
- Top 50 TNOs by long term debt: 2011-20
- Top 50 TNOs by short term debt: 2011-20
- Top 50 TNOs by total cash and short term investments ($M): 2011-20
Coverage
Operator coverage:
| A1 Telekom Austria | Advanced Info Service (AIS) | Airtel | Altice Europe | Altice USA | America Movil | AT&T | Axiata | Axtel | Batelco |
| BCE | Bezeq Israel | Bouygues Telecom | BSNL | BT | Cable ONE, Inc. | Cablevision | Cell C | Cellcom Israel | CenturyLink |
| Cequel Communications | Charter Communications | China Broadcasting Network | China Mobile | China Telecom | China Unicom | Chunghwa Telecom | Cincinatti Bell | CK Hutchison | Clearwire |
| Cogeco | Com Hem Holding AB | Comcast | Consolidated Communications | Cyfrowy Polsat | DEN Networks Limited | Deutsche Telekom | Digi Communications | DirecTV | Dish Network |
| Dish TV India Limited | DNA Ltd. | Du | EE | Elisa | Entel | Etisalat | Fairpoint Communications | Far EasTone Telecommunications Co., Ltd. | Frontier Communications |
| Globe Telecom | Grupo Clarin | Grupo Televisa | Hathway Cable & Datacom Limited | Idea Cellular Limited | Iliad SA | KDDI | KPN | KT | Leap Wireless |
| LG Uplus | Liberty Global | M1 | Manitoba Telecom Services | Maroc Telecom | Maxis Berhad | Megafon | MetroPCS Communications | Millicom | Mobile Telesystems |
| MTN Group | MTNL | NTT | Oi | Omantel | Ono | Ooredoo | Orange | PCCW | PLDT |
| Proximus | Quebecor Telecommunications | Rakuten | Reliance Communications Limited | Reliance Jio | Rogers | Rostelecom | Safaricom Limited | Sasktel | Shaw |
| Singtel | SITI Networks Limited | SK Telecom | Sky plc | SmarTone | SoftBank | Spark New Zealand Limited | Sprint | StarHub | STC (Saudi Telecom) |
| SureWest Communications | Swisscom | Taiwan Mobile | Tata Communications | Tata Teleservices | TDC | TDS | Tele2 AB | Telecom Argentina | Telecom Egypt |
| Telecom Italia | Telefonica | Telekom Malaysia Berhad | Telenor | Telia | Telkom Indonesia | Telkom SA | Telstra | Telus | Thaicom |
| Time Warner | Time Warner Cable | TPG Telecom Limited | True Corp | Turk Telekom | Turkcell | Veon | Verizon | Virgin Media | Vivendi |
| Vodafone | Vodafone Idea Limited | VodafoneZiggo | Wind Tre | Windstream | Zain | Zain KSA | Ziggo |
Regional coverage:
| Asia | Americas | Europe | MEA |
Visuals