By Matt Walker
This report reviews the growth and development of the carrier-neutral network operator (CNNO) market. The report tracks a wide range of financial stats for 47 CNNOs across the globe, from 1Q11 through 4Q24. For the full-year 2024, the companies covered by this study represented $106.7 billion (B) in revenues (+0.2% YoY), and $42.9 B in capex (+6.8% YoY). At the end of 2024 (EOY24), these CNNOs had $261.1B of net plant, property and equipment (net PP&E) on the books (-0.5% YoY), and employed approximately 112,000 people (-2.0% YoY).
The CNNO market is the smallest of three operator segments tracked by MTN Consulting, alongside telco & webscale, but CNNOs play a crucial, complementary role in the communications sector and own and operate a large portion of the world’s cell towers, small cells, data centers, and wholesale fiber networks. In the old days, telcos did it all: they owned all the network infrastructure, they manufactured the switches and transmission gear deployed in the network, and even provided CPE. That model is long since extinct. The telco of 2025 cobbles together its physical network from a mix of owned and leased or rented resources. Over the years, many telcos have raised funds by selling off parts of their physical plant to private equity funds with infrastructure arms, or to public CNNOs. Usually there is a leaseback provision as part of the sale, enabling the telco to effectively turn capex into opex. Cloud providers in the webscale world also rely heavily on CNNOs; while they spend heavily on capex ($304B last year), they generally lease fiber or transmission bandwidth, and only own a portion of their data centers. CNNOs do serve other end markets, including various enterprise verticals (finance, media, and energy), and government. But telcos and webscalers are the biggest targets. CNNOs play a vital role in the network design and cost structure of these operators.
CNNOs are constantly reshuffling their asset base to optimize costs and position for growth. The most effective CNNOs have mastered the art of acquiring companies and/or discrete physical networks or facilities, and integrating them smoothly and quickly into existing operations. Finding cost benefits from the greater scale is key, as is being able to cross-sell across a larger universe of customers. This study attempts to focus on the purely ‘neutral’ CNNOs, i.e. the ones that do not have key customers also show up as key shareholders. China Tower, for instance, is majority owned by its top 3 customers, the big local telcos. This is an exception to the rule; we do include China Tower, because of its size and China’s unusual networks ecosystem.
The figures in this study are based on a thorough bottoms-up assessment of the global CNNO market, focusing on companies that are either publicly traded now, or were public in the recent past. We cannot credibly track a company if it is purely private and reports no audited numbers to regulatory authorities. This is also a challenge in other markets, such as webscale, where we are not able to track ByteDance/TikTok officially because it produces no reliable numbers. In the CNNO world, the biggest challenge is private equity. PE’s rising interest in assembling digital infrastructure portfolios is a big reason for the growth of the CNNO market over the last decade. They’re attempting to create synergies across their digital investees, sometimes through mergers, and synergies with other parts of their investment portfolio. With the rise of GenAI, for instance, some PE firms are investing directly in energy supply in order to ensure competitive rates and terms (e.g. renewable sources) for the data center players in their portoflio. We include some PE-owned companies in this study, if it’s possible to estimate their financials from past reported data. But we also have to exclude some major players; Airtrunk is a good example. It was acquired by PE giant Blackstone late last year, for $16B. This is the CNNO market’s biggest M&A deal in 2024, but we have no realistic way to capture Airtrunk in our database.
Below are some highlights from the report:
Revenues: from under $20B in 2011, the CNNO sector recorded revenues of $106.7B in 2024. That is roughly zero growth YoY, which is not unusual in a year when M&A was almost nonexistent; over the 2018-24 timeframe, CNNO revenue growth averaged 7% per year. In 2024, there were 7 CNNOs with over $5B in annual revenues; from largest to smallest, they are: China Tower ($13.6B), American Tower ($10.1B), Equinix ($8.7B), DigitalBridge ($8.6B), Crown Castle ($6.6B), Level 3 ($6.5B), and Digital Realty ($5.6B). A few of these are exclusively focused on one type of infra, while some are hybrid. China Tower is focused on macro cell towers, but it also has extensive DAS coverage (e.g. 13,126km of subway coverage) and is building an energy business focused on battery exchange and power backup. American Tower is a hybrid, beginning its life as a tower specialist but branching into data centers with the 2021 purchase of CoreSite. Equinix and Digital Realty are data center specialists exclusively, just as Level 3 is focused solely on fiber/bandwidth. Crown Castle owns towers, small cells, and fiber, but is selling off the latter two to Zayo & EQT. DigitalBridge is the oddest of the 7, as it is an investment holding company with stakes in a large number of CNNO-type providers, including towers, small cells/DAS, fiber, and data centers. DataBank and Zayo are two of its largest holdings. To grow over five-fold in a decade, the scope of the market has expanded dramatically, largely through M&A. Since 2011, CNNOs’ M&A has totaled $229.6B, versus $347B for capex.
Capex: from ~$6B in 2011, CNNO capex was $42.9B in 2024. That is up about 7% up from the 2023 total. That’s a healthy level of growth, but nothing like the capex growth of companies focused on hyperscale data center construction. Webscale capex grew by over 50% in 2024. Generative AI hype long ago pushed that market into bubble territory. In CNNO, the GenAI excesses are concentrated in the PE sector, by private companies, being driven by true believer investors who view ‘digital infrastructure’ as a key driving force for future economic growth. Many believe that GenAI can solve many of the world’s problems, including climate change. Among CNNOs without PE backing, some have been using creative financing vehicles to build hyperscale-class facilities for the big cloud providers. In October 2024, for instance, Equinix announced a $15B joint venture with GIC and Canada Pension Plan Investment Board (CPP Investments), to build hyperscale/AI data centers in the US market. Similarly, on a much smaller scale, Digital Realty announced in March 2025 that it would enter the Indonesian market via a JV, with Bersama Digital Infrastructure Asia.
Profitability: average net margin for the CNNO sector was 2.1% in 2024, in line with the 2.7% recorded in 2023, despite Crown Castle booking a big net loss last year related to its fiber network. Free cash flow margin averaged to 2.8% in 2024, up from the -0.8% of 2023. CNNOs had nearly $240B of debt on the balance sheets at EOY24, and just under $22B in cash & investments; net debt, therefore, is still nearly $220B. Both American Tower and Crown Castle have recently announced big asset sales to help lower debt levels, and we can expect more of this to occur in 2025.
Employees: CNNOs ended 2024 with about 112K employees, from 114.3K at EOY2023. CNNOs aim for efficiency in the operation of their infrastructure, and use automation when possible to lower labor costs. However, most CNNOs engage in M&A and hence often need to integrate & rationalize assets before they can reap the scale & synergy benefits. There can be some delay as adjustments to the workforce are made. On a revenue per employee basis, the CNNO sector is impressive, at over $945K per employee in 2024, up slightly from $937K in 2023. These figures are significantly higher than the webscale and telco network operator markets.
Energy: CNNOs consumed an average of 796 MWH per $M of revenues in 2024 (estimated), up from 555 MWh/$M several years ago, in 2019. Data center CNNOs are starting to dominate the market, and they use much higher than average amounts of energy to power their operations. The most energy intensive CNNO in 2023 (the last year with actual data) was ChinData, at 4,403 MWh/$M; Crown Castle was towards the bottom, with just 31MWh/$M.
- Table of Contents
- Figures & Charts
- Coverage
- Visuals
Table of Contents
- Report Highlights
- CNNO Segment Overview
- Analysis
- Operating Metrics
- Key Stats
- Company Drilldown
- Company Benchmarking
- Raw Data
- Exchange Rates
- About
Figures & Charts
- Revenues by CNNO type (US$M)
- Revenues single-quarter (US$M)
- CNNO Profitability, annualized (%)
- Capex & M&A spending, single-quarter (US$M)
- Net PP&E by CNNO type (US$M)
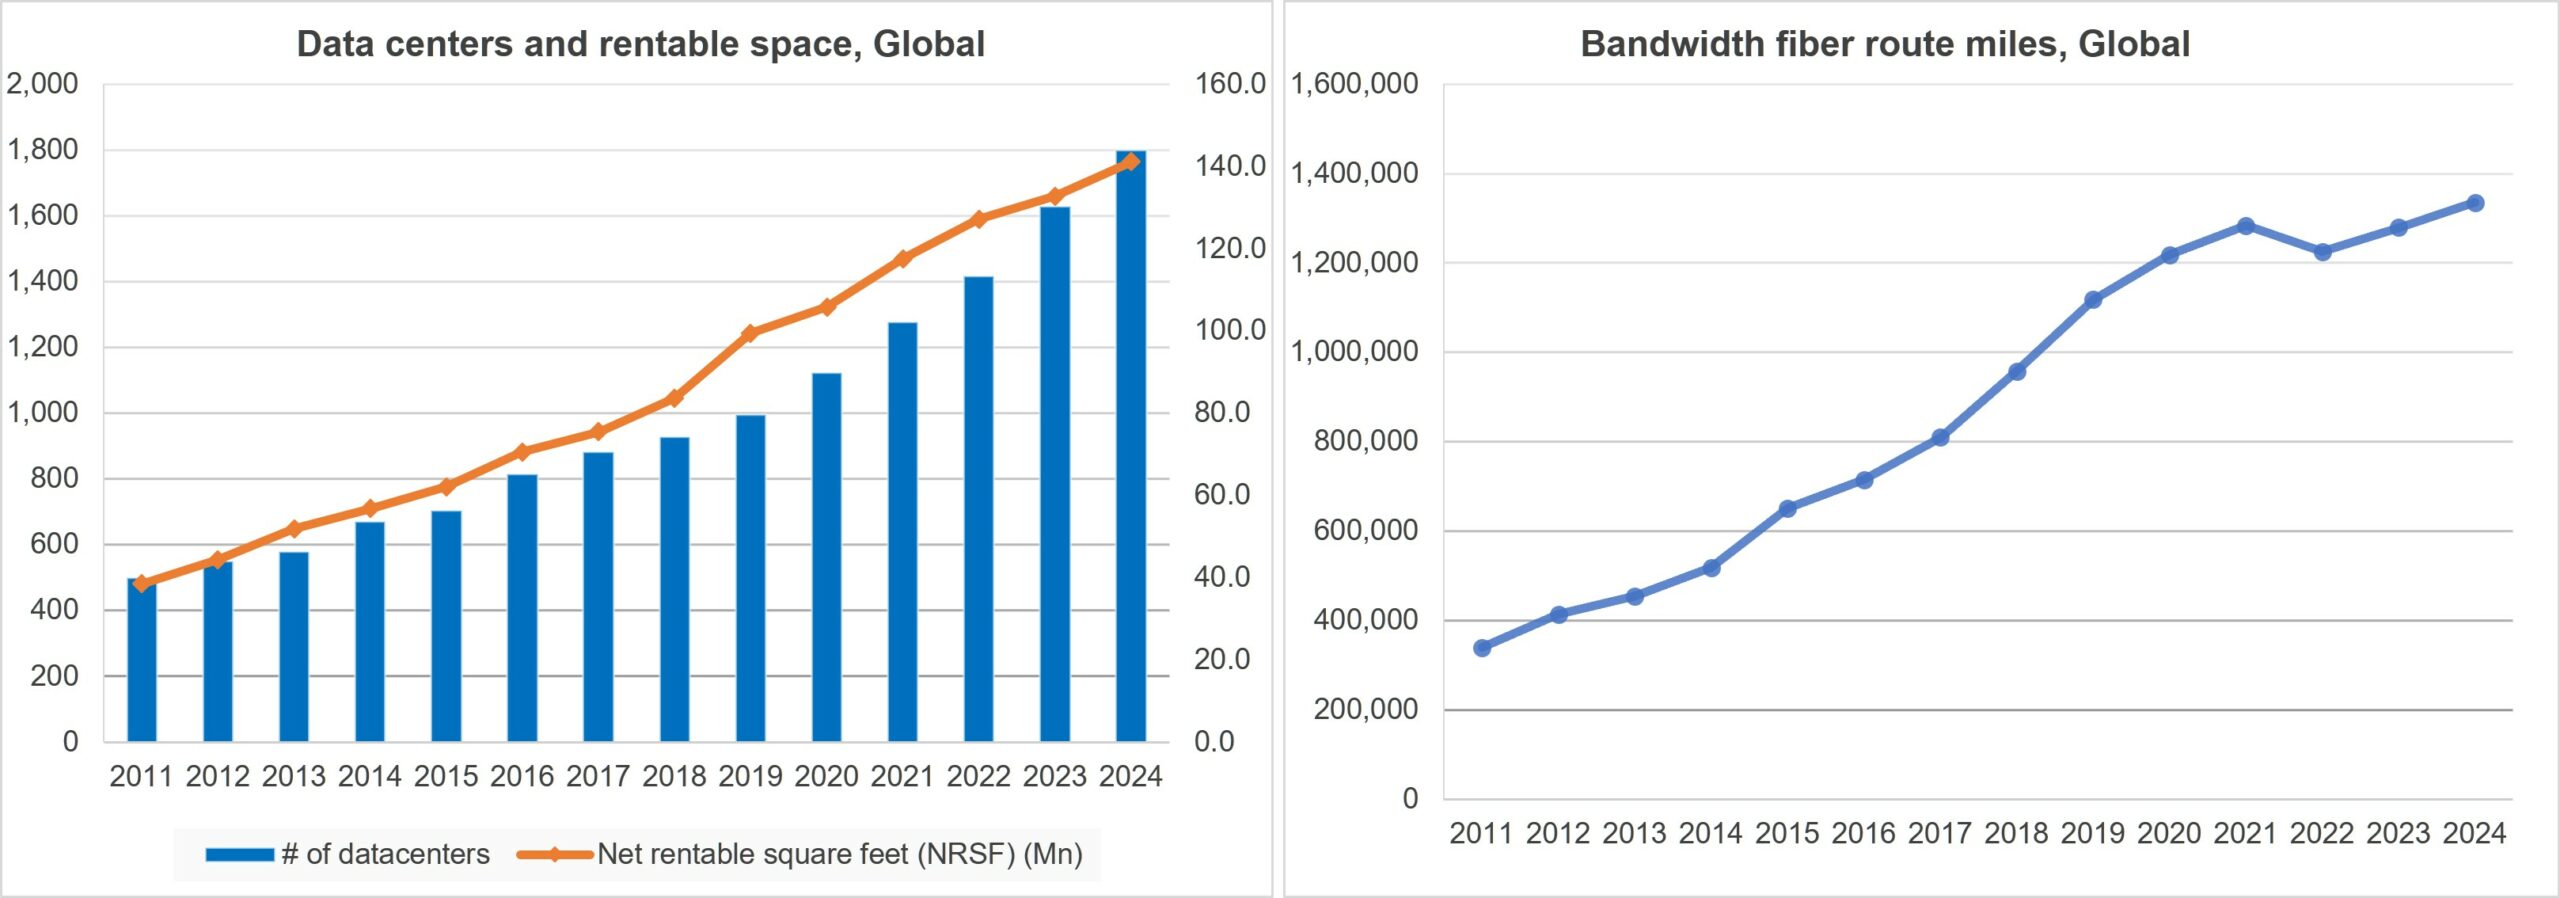
- Number of data centers & NRSF per data center (K)
- Bandwidth fiber route miles, Global
- CNNO towers & average tenancy ratio
- Average size of data center, owned vs. leased: Equinix (000s of sq ft)
- Average number of cabinets installed, owned vs. leased: 21ViaNet
- # OF DATACENTERS: Global
- NET RENTABLE SQUARE FEET (NRSF) (MN): Global
- NRSF PER DATA CENTER (K): Global
- # OF TOWERS: By Region
- NUMBER OF TENANTS: By Region
- AVG TENANCY PER OCCUPIED TOWER: By Region
- ROUTE MILES OF FIBER: Global
Below charts by total CNNO market and by companies:
- Revenues: annual, single-quarter, and annualized (US$M)
- Profitability (Net Profit; Cash from operations; Free cash flow): annual, single-quarter, and annualized (US$M)
- Spending (M&A; Capex): annual, single-quarter, and annualized (US$M)
- Cash & Short-term Investments: annual and single-quarter (US$M)
- Debt (Total debt; Net debt): annual and single-quarter (US$M)
- Property, Plant & Equipment: annual and single-quarter (US$M)
- Key Ratios: Net margin; Capex/revenues; M&A/revenues; Free cash flow/revenues
- Total employees
- Energy Intensity in CNNO sector
- Energy Intensity by Company, 2023 (MWh/$M)
- Revenue per employee, annualized (US$K)
- FCF per employee, annualized (US$K)
- Net PP&E per employee, annualized (US$K)
Company benchmarking charts:
- 2018 vs. 2024: company benchmark by KPI (Revenues, Net profit, Cash from operations, Capex, Free cash flow, Cash & short-term investments, Net PP&E, Total debt)
- 2018 vs. 2024: company benchmark by key ratio (Capex/revenues; Net margin; FCF margin)
- KPI Benchmarking (Revenues, Net profit, Cash from operations, Capex, Free cash flow, Cash & short-term investments, Net PP&E, Total debt)
- Benchmarking by Key ratios: Capex/revenues; Net margin; FCF margin
- Top CNNOs by infrastructure type (2023):
- # of towers
- Avg tenancy per occupied tower
- Number of Tenants
- Route miles of fiber
- # of datacenters
- Net rentable square feet (NRSF) (Mn)
- NRSF per data center (K)
Coverage
The following companies are included in this Market Review:
21Vianet
American Tower
Arqiva
Balitower
Bharti Infratel
ByteDance
Cellnex
China Tower
ChinData
Chorus Limited
Cogent
CoreSite Realty
Crown Castle
CyrusOne
Cyxtera
Databank
Digital Realty
DigitalBridge
DuPont Fabros
EI Towers
Equinix
GDS Data Centers
GTL Infrastructure
GTT Communications
Helios Towers
IBS Towers
IHS Towers
Internap
Interxion
Inwit
Keppel DC REIT
Level 3
Lumos
NBN Australia
NEXTDC
QTS Realty
SBA Communications
SMN (Protelindo)
STP Towers
Summit Digitel
Sunevision
Superloop
Switch
TDF Infrastructure
Telesites
Telxius/Telefonica
Tower Bersama
Uniti Group
Zayo
Visuals