By Matt Walker and Arun Menon
Over the last decade, the carrier-neutral network operator (CNNO) sector has evolved into a key part of the communications industry landscape. The CNNO model has helped telcos to slim down and webscalers to expand their network footprint rapidly.
The CNNO market of today is nearly 4 times the size of a decade ago. Revenues of $19.4 billion in 2011 grew at an average annual rate (CAGR) of 16.3% to reach $75.5 billion in 2020. Growth has slowed with the sector’s maturity, but all three CNNO segments increased revenues in 2020. Towers and data centers were up by around 7% YoY each, while the bandwidth (fiber) segment managed about 2% growth. For the CNNO sector overall, revenues rose by 5.7% in 2020. That’s far less than webscale but much stronger than the telco market.
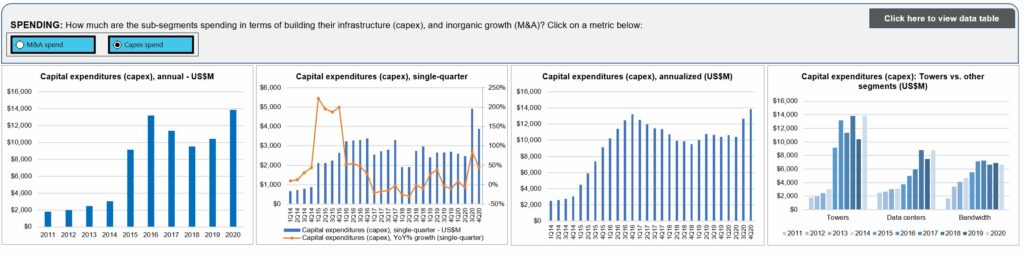
The growth of the CNNO market continues to come from both acquisition of assets (including telco spin-offs) and organic investment. The CNNO sector’s $29.3B in capex was nearly triple its $10.3B in M&A spend in 2020, but this relationship is sometimes reversed, as in 2017 when big deals from China Tower, Crown Castle, and American Tower drove M&A spend sky high. Cellnex was the most eager acquirer in 2020, with $6.5B in M&A costs on the back of deals with Iliad, Altice, Arqiva, and CK Hutch. Digital Realty and Equinix were also significant, with the former buying Interxion, and the latter purchasing Packet, GPX India, and 13 data centers from Bell Canada. The fiber/bandwidth segment had a quiet year for M&A in 2020, in part due to the privatization of Zayo, which had been an active acquirer in the past.
Both capex and acquisitions contribute to growth in CNNOs’ net property, plant and equipment (net PP&E). In aggregate, net PP&E on the books for the CNNO sector is now about $215B. That’s a bit more than half of the $429B in net PP&E recorded by the webscale sector of operators for 4Q20. Assets in the carrier-neutral sector at year-end 2020 included 788 data centers, nearly 2.7 million towers, and just under 800K route miles of fiber.
Employment in the sector is also growing. CNNO employees edged up from 90.7K in 2019 to 95.4K in 2020. That growth was roughly the same rate as revenues, though, leaving revenues per employee roughly flat at just under $800,000. As CNNOs scale their operations, they are searching for ways to optimize their asset management practices, and using automation when possible. Revenue per employee figures are likely to rise in the future.
Looking forward
As discussed in a recently published report (“Tomorrow’s carrier-neutral operators to integrate tower, fiber and DC assets”), MTN Consulting believes the CNNO sector is facing some changes to its structure.
As noted above, we segment the CNNO market into three parts based on asset focus: towers, data centers, and bandwidth (fiber). These dividing lines have always been imperfect as there is some ownership across asset category. Some of that crossover has come from M&A, as for example with tower specialist Crown Castle’s 2017 acquisition of Lightower and its vast fiber network. Some has come from incremental expansion of business models, as with Zayo building small cells on top of its fiber network, or Equinix’s investment in data center interconnect optical networks. Some has resulted from a telco spinning off multiple types of infrastructure at once, creating a new entity like the Uniti Group with holdings across fiber, towers, and data centers. Private equity investments across sector boundaries has also driven some of the integration, a trend which is accelerating now thanks to Digital Bridge, GI Partners, Macquarie and others.
Looking forward, MTN Consulting expects the CNNO market to be driven by entities with holdings across all three types of infrastructure. Publicly held and private equity-controlled CNNOs will seek to offer integrated “digital infrastructure” to communications network operators, with a focus on the telco and webscale markets as their primary customers. One of many reasons for this integration is the challenges faced by today’s CNNOs: high levels of debt, weak cash flows, declining tenancy ratios in the tower sector, and the emergence of a need for data center and fiber buildouts at the network’s edge. There will continue to be many niche CNNOs focused on one specific type of asset, or two (e.g. towers and fiber), but the economic logic for a more integrated offering is compelling. The new breed of CNNOs will compile some of their network by M&A, as they always have, but there will be significant new investment in network expansion, especially in the data center and fiber space.
The creation of a converged CNNO sector will not happen overnight. Deal negotiation and integration takes time, and new network assets take even longer to build. Further, the integration of the CNNO sector will require software platforms and sales teams that can sell, provision and support several very different types of assets. The opportunity for this integration to benefit the wider communications sector is clear, though. What is not yet clear is which big players will best exploit the opportunity. That will require assembling large amounts of capital, experienced executive teams, and a slightly longer time horizon than is the norm for private equity. The integrated CNNOs who thrive will rely heavily on their technology partners in the network.
Specialized CNNOs will continue to exist, and often thrive. There will always be room for niche providers focused on best-of-breed offerings, sometimes leveraging a unique business model or geographic specialty. Even these companies, though, will face the reality of economies of scale in the network business, and will be compelled to grow bigger in order to stay competitive on pricing and coverage.
*
Report format: Excel
Companies covered:
- Towers: American Tower, Bharti Infratel, Cellnex, China Tower, Crown Castle, EI Towers, GTL Infrastructure, Inwit, Balitower, Inti Bangun Sejahtera, Sarana Menara Nusantara, Solusi Tunas Pratama, Tower Bersama Infrastructure, SBA Communications, Arqiva, TDF Infrastructure/Arcus, Telesites, Telxius/Telefonica
- Data centers: CoreSite Realty, CyrusOne, Digital Realty, DuPont Fabros, Equinix, Interxion, QTS Realty, Switch, GDS Data Centers
- Bandwidth: Chorus Limited, Cogent, Internap, Level 3, Lumos, NBN Australia, Superloop, Uniti Group, GTT Communications, and Zayo
Data series included:
Revenues, Net Profit, Cash & short-term investments, Total debt, Net PP&E, Cash from operations, Capital expenditures (capex), Acquisition spending, Employees, Key ratios
Operating metrics:
- Towers: # of towers, Number of tenants, Average tenancy per occupied tower
- Data centers: # of datacenters, Net rentable square feet (NRSF) (Mn), NRSF per data center (K)
- Bandwidth: Fiber route miles
- Table of Contents
- Figure & Charts
- Visuals
Table of Contents
- Abstract
- CNNO Segment Overview
- Analysis
- Operating Metrics
- Key Stats thru 4Q20
- Segment Drilldown
- Company Drilldown
- Company Benchmarking
- Raw Data
- Exchange Rates
- About
Figure & Charts
- Revenues by CNNO type (US$M)
- Revenues single-quarter (US$M)
- CNNO Profitability, annualized (%)
- Capex & M&A spending, single-quarter (US$M)
- Net PP&E by CNNO type (US$M)
- Number of data centers & NRSF per data center (K)
- Bandwidth fiber route miles, Global
- CNNO towers & average tenancy ratio
Below charts by total CNNO market, CNNO sub-segments, and by companies:
- Revenues: annual, single-quarter, and annualized (US$M)
- Profitability (Net Profit; Cash from operations; Free cash flow): annual, single-quarter, and annualized (US$M)
- Spending (M&A; Capex): annual, single-quarter, and annualized (US$M)
- Cash & Short-term Investments: annual and single-quarter (US$M)
- Debt (Total debt; Net debt): annual and single-quarter (US$M)
- Property, Plant & Equipment: annual and single-quarter (US$M)
- Key Ratios: Net margin; Capex/revenues; M&A/revenues; Free cash flow/revenues
- Total employees
- Revenue per employee, annualized (US$K)
- FCF per employee, annualized (US$K)
- Net PP&E per employee, annualized (US$K)
Company benchmarking charts:
- 2011 vs. 2020: company benchmark by KPI (Revenues, Net profit, Cash from operations, Capex, Free cash flow, Cash & short-term investments, Net PP&E, Total debt)
- 2011 vs. 2020: company benchmark by key ratio (Capex/revenues; Net margin; FCF margin)
- Top 5 CNNOs by sub-segment: by KPI (Revenues, Net profit, Cash from operations, Capex, Free cash flow, Cash & short-term investments, Net PP&E, Total debt)
- Top 5 CNNOs by sub-segment by Key ratio: Capex/revenues; Net margin; FCF margin
Visuals