By Matt Walker
Big tech’s webscale buildout keeps breaking records. In 1Q25, the 22 companies in our Webscale Tracker, including new entrant CoreWeave, generated $652 billion (B) in revenue (+9.2% YoY), spent $97B on capex (+67.2%), poured $84B into R&D (+12.2%), and held $635B in cash (-3.6%) against $560B in debt (+1.3%). Net PP&E surged 32.9% YoY to nearly $1 trillion. Headcount hit 4.17M, flat YoY.
🔹 Revenue: Growth Concentrated in the Big Four
1Q25 revenue hit $651.6B (+9.2% YoY), pushing annualized sales to $2.65T. Coreweave and Yandex posted the fastest growth, but the heavy lifting came from Alphabet (annualized revenues up 13.1% vs. 2Q23-2Q24), Amazon (+10.1%), Meta (+19.4%), and Microsoft (+14.1%).
Amazon added the most dollars: up $12.4B YoY to $155.7B (+8.6%).
At the other end: Fujitsu’s revenue dropped 18.7% as it retreats from cloud and data center services. Baidu, eBay, and IBM posted sub-2% growth.
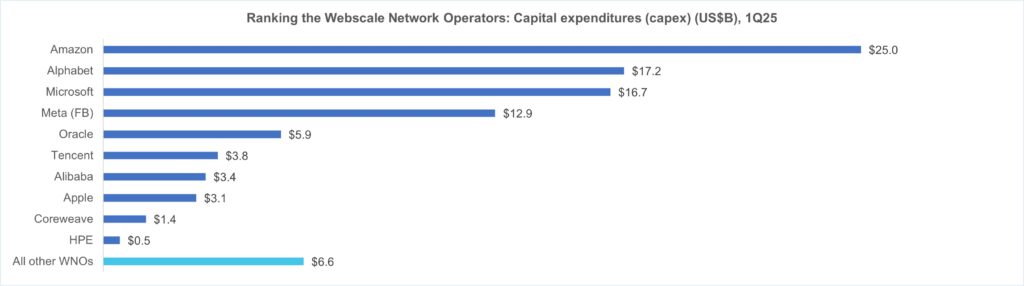
🔹 Capex: AI Hype Sends Spending Soaring
Capex skyrocketed 67.2% YoY in 1Q25 to $96.6B, annualizing to $343B, up 65% from a year ago and setting another all-time high.
The AI frenzy, sparked by ChatGPT and fanned by investors, is now a dominant force. GPU spend is through the roof. US webscalers are spending like the proverbial drunken sailor, fueled by subsidies and hype, and enabled by what many view is widespread intellectual property theft.
Top 1Q25 capex outlays came from Amazon ($25.0B), Alphabet ($17.2B), Microsoft ($16.7B), and Meta ($12.9B. Together, that is 74% of the total.
Notably, 58% of annualized capex was for IT/network/software infrastructure (vs. 55% in 1Q24, 49% in 1Q23), showing a focus on retrofitting existing data centers for AI.
🔹 Profitability: Margins Under Pressure from Capex
Free cash flow margins dipped to 15.2% in 1Q25 (annualized), down from 18.9% a year earlier. Net profit margins averaged a healthy 20.7% over the last four quarters. Alphabet led with $34.5B in net income (+46% YoY), a political liability as antitrust scrutiny intensifies.
Meta, Microsoft, Tencent, and Apple topped the FCF leaderboard.
Amazon and Alibaba were mid-tier, while HPE and Baidu brought up the rear.
Debt vs. cash positions remain solid overall, but some players (Apple, Oracle, IBM, Coreweave) are deeply leveraged and vulnerable if the AI bubble bursts.
🔹 Employment: Flat Growth, Automation Looms
Webscale employment hit 4.17M, up just 0.2% YoY. Alibaba’s 39% headcount drop (via Sun Art divestment) offset growth elsewhere.
Despite massive AI investment, workforce growth has plateaued since 2021. Automation and robotics are gaining ground, especially in logistics. We expect modest headcount gains in 2025, then a steady decline.
🔹 Regional Trends: Asia Rebounds
Asia-Pacific’s drag is easing: regional revenue grew 7% YoY in 1Q25, narrowing the gap with global growth (+9%).
The Americas, Europe, and MEA remain in the low double-digit range. With strong government backing, Tencent and Alibaba are poised to accelerate Asia’s momentum through 2026.
- Table Of Contents
- Figures & Charts
- Coverage
- Visuals
Table Of Contents
- Report highlights
- Outlook
- Analysis
- Key Stats
- Company Drilldown
- Company Benchmarking
- Regional Breakouts
- Raw Data
- Exchange Rates
- About
Figures & Charts
- Key Metrics: Growth rates, Annualized 1Q25/1Q24 vs. 2021-24
- WNO Revenues: Single-quarter & annualized (US$M)
- Top 8 WNOs: YoY revenue growth in 1Q25
- Annualized profitability: WNOs
- Free cash flow per employee, 1Q25 annualized (US$)
- FCF Margins vs. Net Margins, 1Q25 annualized
- Advertising revenues as % total (FY2024)
- Annualized capex and R&D spending: WNOs (% revenues)
- WNO capex by type, Annualized: 1Q16-1Q25 (US$M)
- Network & IT capex as share of revenues, 1Q25 annualized
- R&D expenses as % revenues, Top 8 WNOs (1Q25 annualized)
- Acquisition spending vs. capex spending, annualized (US$M)
- Net PP&E per employee (US$’ 000) – 1Q25
- Ranking the Webscale Network Operators: Revenues; R&D; Capex; Network & IT capex – 2024 & 1Q25 (US$B)
- Annualized spending share for key webscalers since 2011 Capex: Network, IT and software
- Share of webscale spending by company, 1Q25 and 1Q24 annualized (Capex: Network, IT and software)
- Energy consumption vs. Net PP&E for key webscalers in 2024
- USA: Webscale capex total ($M) and % of global market, 2011-24
- Webscale vs. Telco Market: Annualized Capex (US$B)
- Webscale vs. Telco Market: Annualized capital intensity
- Revenues: annual, single-quarter, and annualized (US$M)
- Profitability (Net Profit; Cash from operations; Free cash flow): annual, single-quarter, and annualized (US$M)
- Spending (R&D; M&A; Capex; Network & IT capex; Lease): annual, single-quarter, and annualized (US$M)
- Cash & Short-term Investments: annual and single-quarter (US$M)
- Debt (Total debt; Net debt): annual and single-quarter (US$M)
- Property, Plant & Equipment: annual and single-quarter (US$M)
- Key Ratios: Net margin; R&D/revenues; Capex/revenues; Network & IT capex/revenues; Free cash flow/revenues; Lease costs/revenues – annual and annualized (%)
- Total employees
- Revenue per employee, annualized (US$K)
- FCF per employee, annualized (US$K)
- Net PP&E per employee, annualized (US$K)
- Revenues & Spending (US$M)
- Revenues (US$M) & YoY revenue growth (%), single-quarter: by company
- Revenues, annualized (US$M): by company
- Annualized profitability margins: by company
- Annualized capex and capital intensity: by company
- Annualized capex and R&D spending as % of revenues: by company
- Share of WNO network & IT capex, Annualized: by company
- Total employees: by company
- Annualized per-employee metrics (US$000s): by company
- Net debt (debt minus cash & stock) (US$M): by company
- Top 10 webscale employers in 1Q25: Global market
- Headcount changes in 1Q25 (YoY %): Global market
- Net PP&E: USA vs. RoW (by company)
- Net PP&E: total in $M and % global webscale market (by company)
- Energy consumption, MWh and % webscale total (by company)
- Share of webscale energy consumption, net PP&E, and capex (by company)
- Energy intensity relative to webscale average and select data center-focused CNNOs (by company)
- Energy intensity in webscale sector, 2024: MWh consumed per $M in revenue
- Capex/revenues (annualized): Company vs. Webscale average
- Revenue per employee (US$000s) (annualized): Company vs. Webscale average
- 2018 vs. 2024: company benchmark by KPI (Revenues, R&D, Net profit, Cash from operations, Capex, Free cash flow, Cash & short-term investments, Net PP&E, Total debt)
- 2018 vs. 2024: company benchmark by key ratio (Capex/revenues; R&D/revenues; Net margin; FCF margin)
- Top 8 WNO’s share vs. Rest of the market: by KPI (Revenues, R&D, Net profit, Cash from operations, Capex, Free cash flow, Cash & short-term investments, Net PP&E, Total debt)
- Top 8 WNOs benchmarking by Key ratio: Capex/revenues; R&D/revenues; Net margin; FCF margin)
- Total WNO Market Revenues, by region: Latest CY; Latest Quarter; Annual trend (2011-24); Single quarter (1Q16-1Q25 )
- WNO Market: Revenues, single-quarter (YoY % change)
- Regional revenues by operator: Latest CY; Latest Quarter; Annual trend (2011-24); Single quarter (1Q16-1Q25)
- Top 10 operators by region: Latest CY; Latest Quarter
Coverage
| Top 8 WNOs | |||
| Alibaba | Alphabet | Amazon | Apple |
| Baidu | Meta (FB) | Microsoft | Tencent |
| Other WNOs | |||
| Altaba | ChinaCache | Cognizant | eBay |
| Fujitsu | HPE | IBM | JD.com |
| Oracle | SAP | ||
| Yandex | Coreweave | ||
Visuals