By Matt Walker
Webscale surges to $1.71 trillion in revenues, about to overtake telecom sector
The webscale market of operators continued blockbuster growth in 2020, ending the year with just over $1.71 trillion in revenues, from $1.45T in 2019. The growth is due to several factors: acquisitions (e.g. Alibaba-Sun Art, Amazon-Zoox, and Microsoft-Zenimax); strong digital advertising spend (e.g. Google up 9% YoY to $146.9B), and increased cloud spending across a number of verticals amidst the COVID-19 pandemic. Webscale revenues are now just a bit below telecom operator revenues, which ended 2020 at $1.79 trillion.
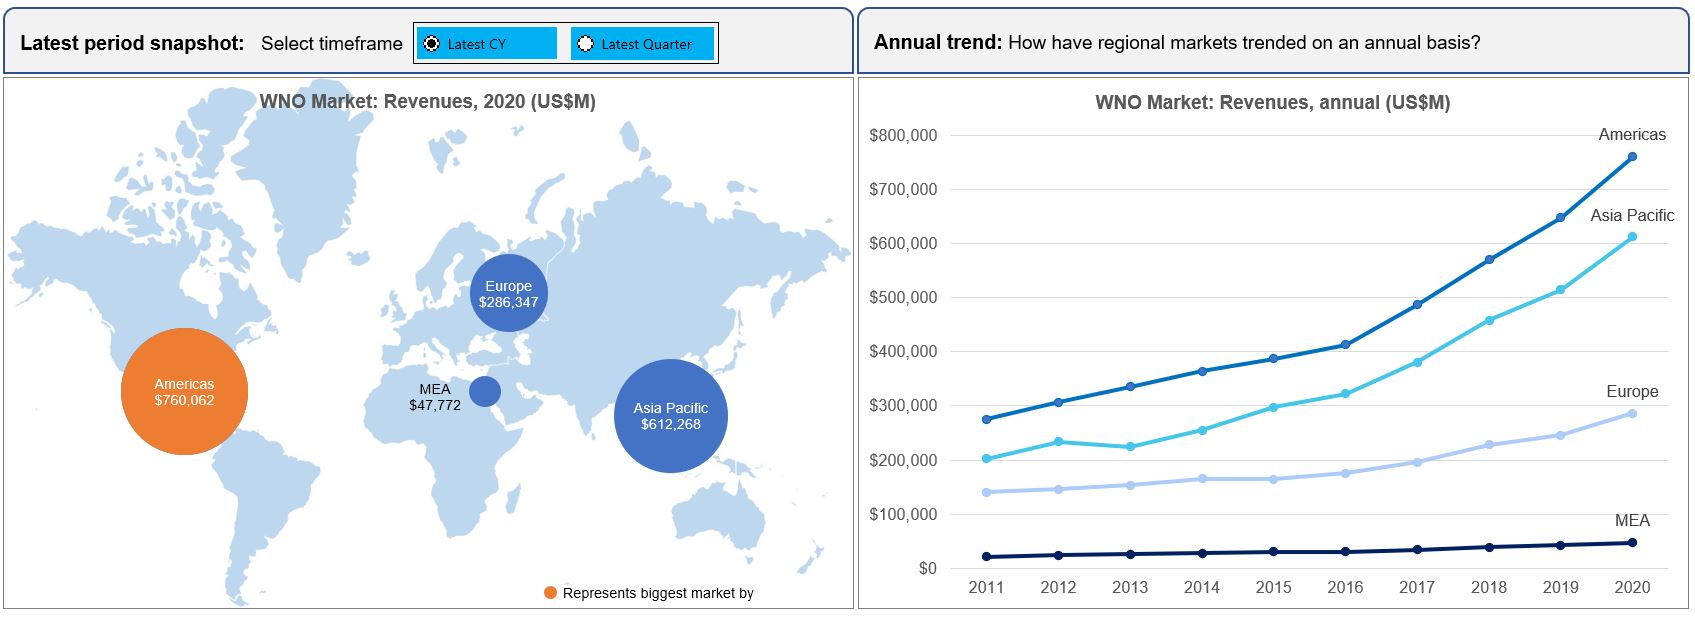
Americas remain the largest regional market
All regions saw significant growth in 2020. Asia-Pacific grew the fastest, with revenues up 19% to $612.3B or 35.9% of the global market. The Americas grew 17.4% YoY to $760.1B or 44.5% of the global market. Europe’s growth rate was third fastest, up 16.8% YoY, to $286.3B. The Europe region is also third largest, accounting for just under 17% of global revenues. Finally, the MEA market struggled in 2020, growing just 12.8%. MEA’s $47.8B in 2020 revenues accounts for 2.8% of the global webscale total. Several cloud providers are building out capacity in the MEA market, though, and the region’s subsea cable connectivity is improving, so faster growth is likely on the way for MEA.
Telecom capex now just 2.2x that of webscale, from 4.5x in 2016
While COVID-19 depressed the telco sector in 2020, strong demand for cloud services and ecommerce drove the webscale operators providing these services to expand investments considerably. Capital spending in the webscale sector leaped 42% YoY in 4Q20 to $40.1B, pushing the full-year 2020 total to $132.8B. That’s 28% higher than the 2019 result. Capex growth outpaced revenues, pushing the industry’s capital intensity ratio up to 7.8%, from 7.1% in 2019. This is still below the 8.6% achieved in 2018, however, during the last boom of new data center construction.
The network/IT/software portion of capex in 2020 was lower than expected, just 42%, from 44% in 2019. That is partly because of methodology changes in how MTN Consulting estimates the tech portion of webscale capex. It is also due to relatively high capex in 2020 by ecommerce-focused players like Amazon and Alibaba, who spend more on logistics and fulfillment than on data centers. Going forward, we expect the non-tech portion of webscale capex to remain well below 50% as a spate of new data centers are constructed in the 2021-22 period, but begin to grow towards 50% by 2025, as more of capex is for server/capacity expansion of existing infrastructure. Within the technology piece of capex, data centers and their components (networking, compute, storage, power) will soak up the bulk of spending, but subsea cables and satellite networks will become increasingly important over the next 5 years.
Who benefits from webscale capex?
The network spending of big webscalers is centered around immense, “hyperscale” data centers and undersea cable systems that support network traffic from the tech companies’ online retail, video, and social media platforms, along with cloud services. Webscale network operators (WNOs) may also own access networks, typically using fiber, microwave or mmWave, and even fixed satellite. WNOs exploring outer space for providing connectivity include Amazon, Apple, Alphabet, Facebook, and Microsoft.
A broad set of vendors are benefiting from WNO capex spending – from semiconductor players selling into the data center market (Intel, AMD, Nvidia, Broadcom, etc), to optical components & transport vendors selling into data center interconnect markets (Ciena, Infinera, Neophotonics, Lumentum, etc.), to contract manufacturers of white box/OCP servers (Wistron and Quanta).
R&D spending plateaus in 2020
R&D spending increased at the relatively modest rate of 15.1% in 2020 for webscale operators. As a result, the webscale sector’s R&D to revenues ratio fell slightly in 2020, from 10.8% in 2019 to 10.5% in 2020. R&D spending is still comfortably higher than capex, at $179.5B in 2020, versus $132.8B for capex. R&D spend involves software development by employees and hardware design and development for both existing product ranges (e.g. Apple’s iPhone) and entirely new lines of business with unproven potential (e.g. connected cars).
Focusing on R&D spending by the Top 8 group of providers, Facebook was the leader as usual, spending 21.5% of revenues on R&D in 2020. Baidu was an impressive second, investing heavily in AI and autonomous vehicles. Tencent and Alibaba are near the bottom, but rising under government pressure. Apple’s tech capex and R&D spending patterns are both low relative to peers, and more in line with a consumer electronics company than a software company.
Average profitability improved in 2020
As the webscale sector’s topline has surged during the pandemic, the sector’s bottom line profitability has improved even faster. The sector’s average net profit margin rose from 17.2% in 2019 to 18.1% in 2020, while average free cash flow margin increased from 18.9% to 19.8%. In 4Q20, both annualized net margin and FCF margin increased versus 3Q20.
By company, Tencent, Microsoft and Facebook took the top three spots in 2020, on both a FCF and net income margin basis. Amazon placed last, as usual, but its slim margins have not prevented its market cap from soaring to $1.65 trillion (as of 8 April 2021). Apple’s margins put it in the middle of the pack, but its regulatory threats are minimal, reliance on ad revenues negligible, and Huawei’s recent struggles help Apple.
Cash on hand, including short-term liquid investments, amounted to $757 billion for the webscale sector at the end of 2020, up 13% YoY. Total debt was less, ending the year at $481 billion, and this grew at the slower rate of 10% in 2020. As a consequence, net debt was -$276.6B at the end of 2020, an improvement from -$228.8B at the end of 2019.
Cloud construction plans for 2021-22
The following provides a brief snapshot of investment plans for select webscale operators:
Facebook says its capex for 2021 will be in the range of $21 billion to $23 billion, driven by data centers, servers, network infrastructure and office facilities.” This compares to a 2020 capex total of just $15.1 billion. The company says several projects were delayed in 2020 due to the pandemic.
Amazon’s earnings call revealed very little about its data center plans, in line with its practices. Notably, Amazon promoted its AWS CEO, Andy Jassy, to replace CEO and founder Jeff Bezos in February. AWS is likely to continue getting management support and investment. The 2020 result, however, was clearly due to some one-off investments.
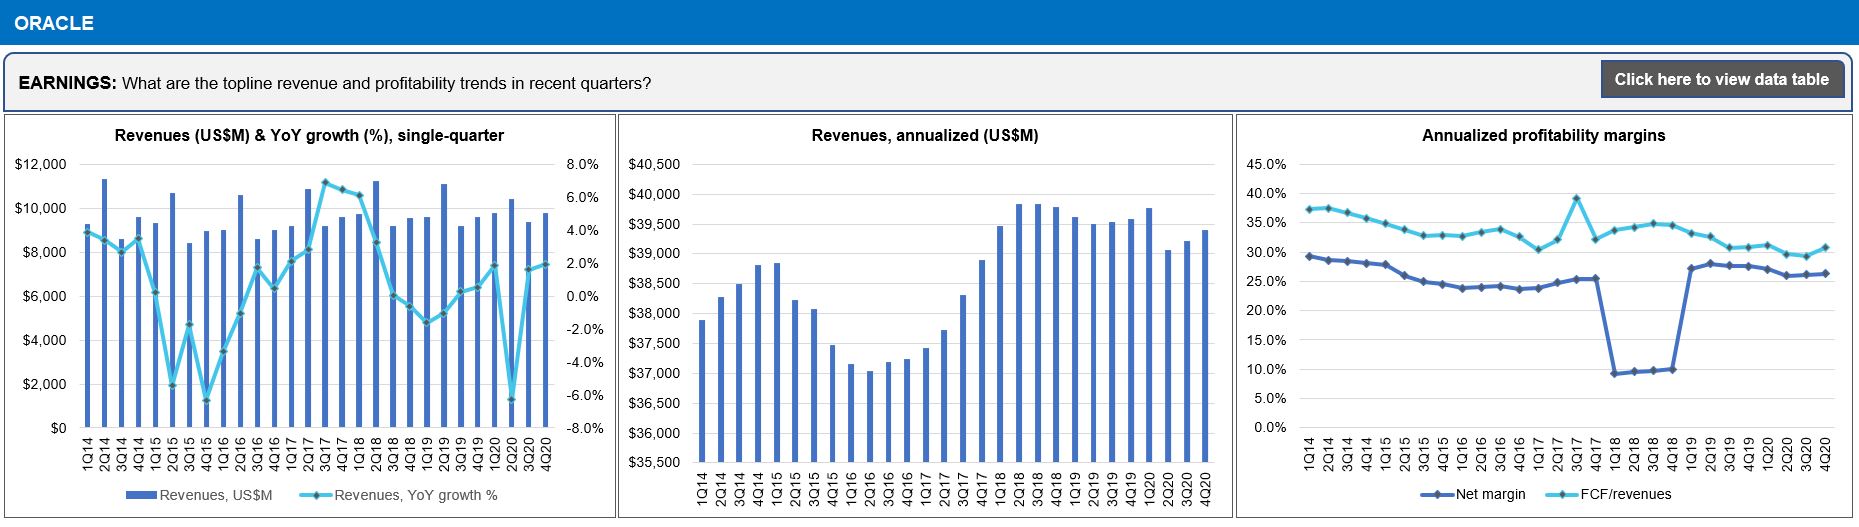
Oracle plans to continue adding new data centers through 2021, and expects to have 38 by YE-2021. The CFO says 1Q21 capex would be around 50% higher than 4Q20. Oracle is a small cloud player relative to Amazon, especially considering Oracle’s heavy reliance on collocated facilities (mainly with Equinix). However, Oracle is clearly becoming more significant in the cloud, and its use of Ampere’s data center chips could also have an impact on the competitive landscape in the chip market.
Alphabet actually decreased its capex slightly in 2020, but the company says the pace of investment will return to normal levels in 2021, with spending on servers driving an increase.
Microsoft expects 1Q21 capex to see a sequential increase (over 4Q20) in order to meet growing demand for Azure services; the company announced 7 new data center regions recently. Microsoft spending on finance leases, a.k.a. capital leases, is also significant and contributes to the company’s network infrastructure footprint.
Apple, Baidu, eBay, IBM, and SAP were mostly silent about the outlook for future capex in recent earnings calls.
–
MTN Consulting’s 4Q20 WNO Market Review analyzes the network infrastructure spending and financial position of webscale network operators (WNOs).
WNOs are web-centric companies who own and operate large multi-country communications networks based upon hyperscale data centers and submarine cables. Webscale operators may also own access networks, typically using fixed satellite or fiber. WNOs own network assets in order to support their core businesses, which comprise digital advertising, online retail, cloud, digital media and content services, and other digital-based services. The webscale segment excludes companies with digital business models who rely primarily on rented cloud capacity or collocation space. Twitter, for instance, is not a webscale operator, as its network relies on a mix of rented space in carrier-neutral data centers and rented cloud resources from Google. By contrast, Apple is webscale; although it has partnerships with GCP and AWS for cloud capacity, Apple owns several large data centers, and is building more.
WNOs tracked in this report include the “Top 8” companies (Alibaba, Alphabet, Amazon, Apple, Baidu, Facebook, Microsoft, and Tencent) and 12 others: Altaba, ChinaCache, Cognizant, eBay, Fujitsu, HPE, IBM, JD.COM, LinkedIn, Oracle, SAP, and Yandex.
Coverage:
- Global coverage with company-level drilldowns of 20 companies
- Company-level annualized and quarterly trends across >10 financial data series
- Network-related spending estimates at market- and company-level, across quarters
- Revenues broken out by region for each company
- Table Of Contents
- Figures & Charts
- Coverage
- Visuals
Table Of Contents
- Abstract
- Analysis
- WNO Market: Key Stats thru 4Q20
- Company Drilldown
- Top 8 WNOs
- Company Benchmarking
- Regional Breakouts
- Raw Data
- Exchange Rates
- About
Figures & Charts
- Key Metrics: Growth rates, Annualized 4Q20/4Q19 vs. 2011-20
- WNO Revenues: Single-quarter & annualized (US$M)
- Top 8 WNOs: YoY revenue growth in 4Q20
- Annualized profitability: WNOs
- Free cash flow per employee, 4Q20 annualized (US$)
- FCF Margins vs. Net Margins, 4Q20 annualized
- Advertising revenues as % total (FY2020)
- Annualized capex and R&D spending: WNOs (% revenues)
- WNO capex by type, Annualized: 4Q15-4Q20 (US$M)
- Network & IT capex as share of revenues, 4Q20 annualized
- R&D expenses as % revenues, Top 8 WNOs (4Q20 annualized)
- Acquisition spending vs. capex spending, 1Q14-4Q20 annualized (US$M)
- Net PP&E per employee (US$’ 000) – 4Q20
- Ranking the Webscale Network Operators: Revenues; R&D; Capex; Network & IT capex – 2020 & 4Q20 (US$B)
- Revenues: annual, single-quarter, and annualized (US$M)
- Profitability (Net Profit; Cash from operations; Free cash flow): annual, single-quarter, and annualized (US$M)
- Spending (R&D; M&A; Capex; Network & IT capex; Lease): annual, single-quarter, and annualized (US$M)
- Cash & Short-term Investments: annual and single-quarter (US$M)
- Debt (Total debt; Net debt): annual and single-quarter (US$M)
- Property, Plant & Equipment: annual and single-quarter (US$M)
- Key Ratios: Net margin; R&D/revenues; Capex/revenues; Network & IT capex/revenues; Free cash flow/revenues; Lease costs/revenues – annual and annualized (%)
- Total employees
- Revenue per employee, annualized (US$K)
- FCF per employee, annualized (US$K)
- Net PP&E per employee, annualized (US$K)
- Revenues & Spending (US$M)
- Webscale Business Mix by Revenues (FY2020) – MTN Consulting estimates
- Top 10 recent acquisitions & investments
- Revenues (US$M) & YoY revenue growth (%), single-quarter: by company
- Revenues, annualized (US$M): by company
- Annualized profitability margins: by company
- Annualized capex and capital intensity: by company
- Annualized capex and R&D spending as % of revenues: by company
- Share of WNO network & IT capex, Annualized: by company
- Total employees: by company
- Annualized per-employee metrics (US$000s): by company
- Net debt (debt minus cash & stock) (US$M): by company
- 2011 vs. 2020: company benchmark by KPI (Revenues, R&D, Net profit, Cash from operations, Capex, Free cash flow, Cash & short-term investments, Net PP&E, Total debt)
- 2011 vs. 2020: company benchmark by key ratio (Capex/revenues; R&D/revenues; Net margin; FCF margin)
- Top 8 WNO’s share vs. Rest of the market: by KPI (Revenues, R&D, Net profit, Cash from operations, Capex, Free cash flow, Cash & short-term investments, Net PP&E, Total debt)
- Top 8 WNOs benchmarking by Key ratio: Capex/revenues; R&D/revenues; Net margin; FCF margin)
- Total WNO Market Revenues, by region: Latest CY; Latest Quarter; Annual trend (2011-20); Single quarter (1Q14-4Q20)
- Regional revenues by operator: Latest CY; Latest Quarter; Annual trend (2011-20); Single quarter (1Q14-4Q20)
- Top 10 operators by region: Latest CY; Latest Quarter
Coverage
| Top 8 WNOs | |||
| Alibaba | Alphabet | Amazon | Apple |
| Baidu | Microsoft | Tencent | |
| Other WNOs | |||
| Altaba | ChinaCache | Cognizant | eBay |
| Fujitsu | HPE | IBM | JD.com |
| Oracle | SAP | Yandex | |
Visuals