By Matt Walker
The webscale market is defined in part by how you build your network: “webscale” includes companies who build and own their own networks (largely data centers), but excludes companies which rely on rented capacity or cloud partnerships, even if they offer similar services. The economies of scale that come from owning your own network are behind this distinction. These economies are becoming more apparent nowadays, not less, as webscalers design and develop more of the technology that goes into their networks. They are at the bleeding edge of data center chip developments, for instance, and work closely with optical components and systems vendors to push for gear that meets their needs. Companies like Facebook appear at industry conferences and end their technical talks with “industry asks” – here is what we need, please build it for us and maybe we’ll buy it. The top few webscalers use their clout to lobby politicians for favorable regulations, and are using their position in the cloud to creep into a growing variety of industries – including telecommunications. It’s nice to be at the top of the food chain.
Webscale revenues now $1.96 trillion over four quarters, more than telecom
The step change in revenue growth for webscalers that appeared in late 2020 has continued. Year over year (YoY) revenue growth in the sector has exceeded 30% for the last two quarters. On an annualized basis, webscale revenues grew 28% YoY in 2Q21 to reach $1.96 trillion, a bit more than the telecom operator market.
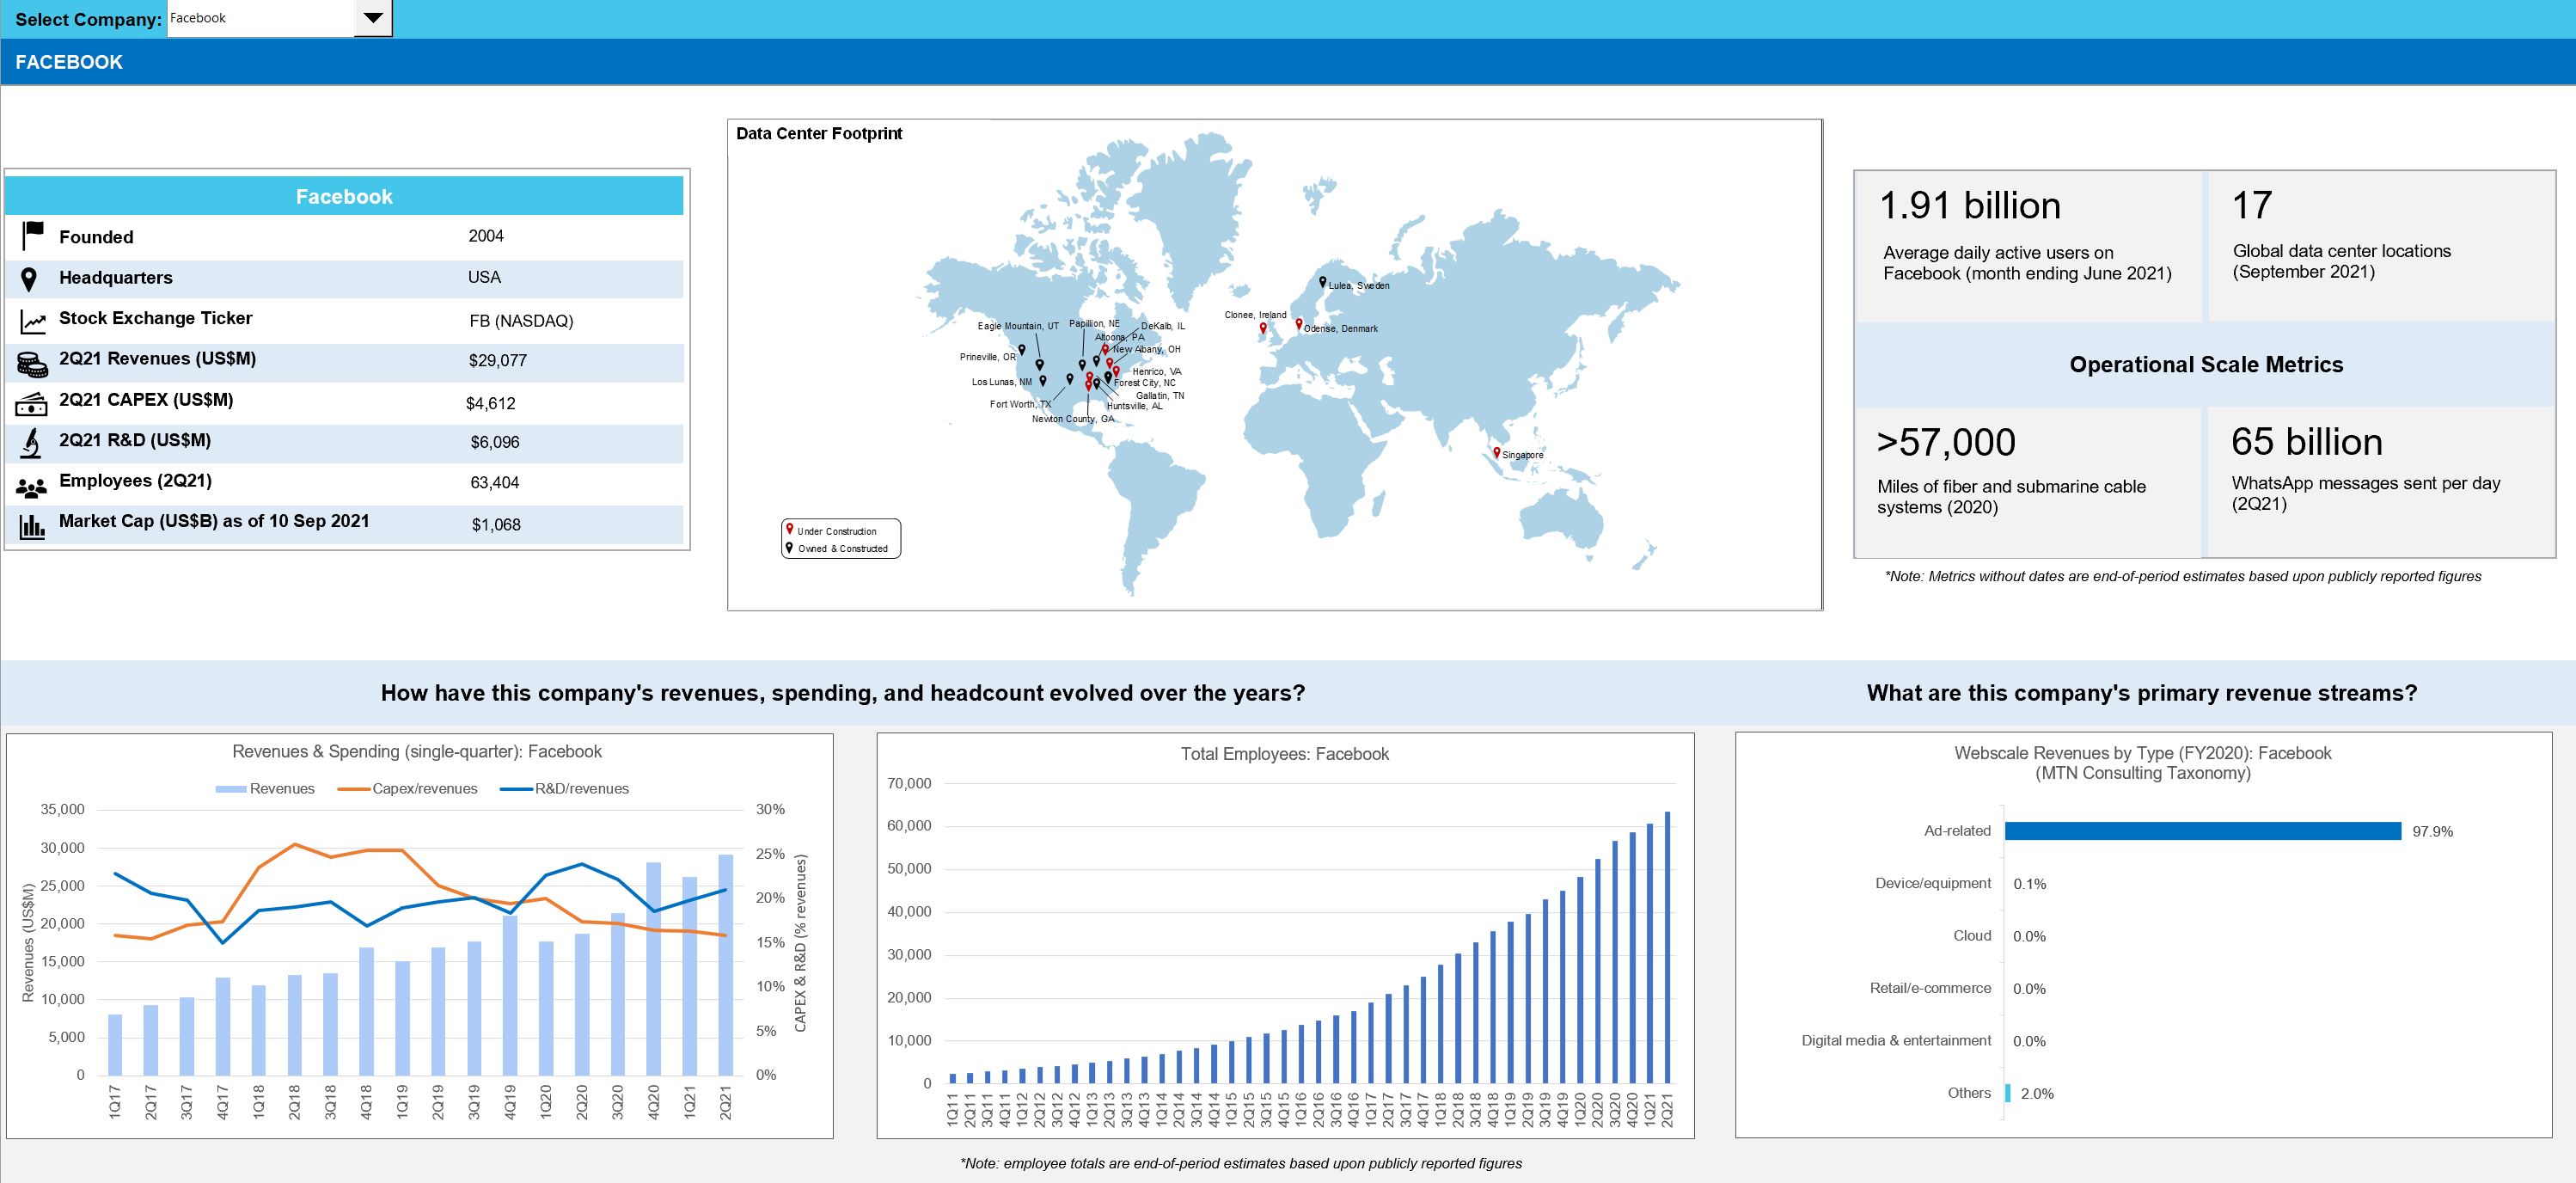
Alphabet and Facebook had the fastest revenue growth rates among large webscalers in 2Q21, and they are also the webscalers most exposed to advertising revenues. Some of their outperformance is due to a relatively weak ad market in 2Q20. But more of it is a function of the increasingly dominant role these two companies play in ad markets. For Alphabet, cloud services revenue growth is also a factor, to be sure. But Google Cloud Platform revenues in 2Q21 grew 53% YoY, less than the company overall, and account for just 7.4% of revenues. There continues to be pressure on Alphabet and Facebook related to content policing, privacy, and anti-competitive practices, but the pressure has not yet made any dent in their revenue (or profit) growth. It remains to be seen whether Apple’s more stringent privacy protections, introduced in 2Q21, will have any effect on Facebook and Alphabet growth.
Europe led webscale growth with revenue growth of 43.1% YoY
All regions saw significant growth in 2Q21. The Americas remains the world’s largest webscale region, accounting for 43.6% of 2Q21 revenues, ahead of Asia’s 35.6% and Europe’s 18.1%. Europe was the dominant region in 2Q21, however, on a growth rate basis. Europe’s webscale revenues in 2Q21 totaled $92.9B, up 43% YoY, well ahead of MEA, which took second place with 36% YoY growth. The MEA market remains the smallest of the four regions, accounting for under 3% of global revenues in 2Q21. However, several cloud providers are building out capacity in the MEA market, and the region’s subsea cable connectivity is improving, so faster growth is likely on the way for MEA.
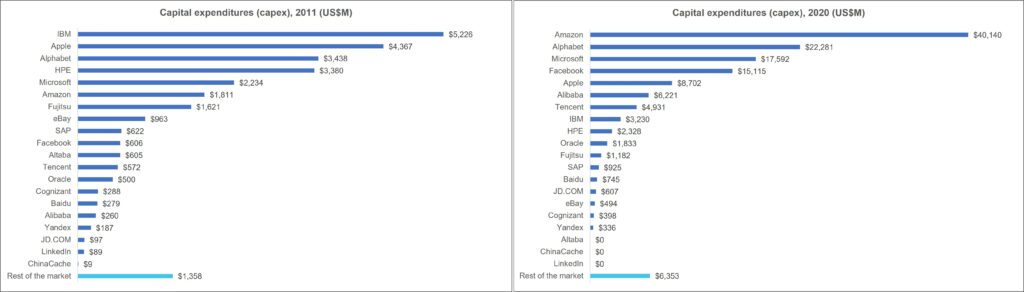
Annualized capex climbs to $153B in 2Q21; data center landgrab continues
Webscale capex has soared in the last few quarters. For the webscale sector as a whole, capex grew 28% in 2020, to $133.4 billion. For the annualized 2Q21 period, capex amounted to $153B, up 34% from 2Q20. The non-tech piece of capex amounted to $90B, or 59% of the total, and grew a bit faster than Network/IT capex in 2Q21. Capital intensity rose throughout 2020 but has flattened since then, ending 2Q21 at 7.8% on an annualized basis.
The webscale sector’s big cloud providers have accounted for much of the recent capex surge. Amazon, Alphabet, and Microsoft have been building larger facilities, expanding existing campuses and clusters, and broadening their cloud region footprint into smaller markets. These three account for just under 60% of global webscale tech capex over the last four quarters. Alibaba and Tencent have been reinforcing their Chinese footprint and expanding overseas, usually with partners. Numerous smaller cloud providers, notably Oracle and IBM, are also expanding their cloud services offerings and coverage, partnering as needed with carrier-neutral operators. Facebook and Apple, while they don’t provide cloud services, also continue to invest aggressively in networks to support large volumes of customer traffic. Just a few examples for Facebook make the reason clear: as of early 2021, it needed to support 65 billion WhatsApp messages per day, over 2 billion minutes of voice and video calls per day, and on a monthly basis its Messenger platform carries 81 billion messages.
The facilities these webscale players are building can be immense. For instance, Microsoft was scheduled to start construction last month on two new data centers in Des Moines Iowa, each of which costs over $1B and measures over 167K square meters (1.8 million square feet). These two are part of a cluster in the area, as is often the case; Microsoft already has three facilities around Des Moines. Facebook is working on a project in DeKalb, Illinois, roughly half the size at 84.2K square meters, costing US$800M and spreading across 500 acres of land. This construction project was announced in 2020 but won’t complete until 2023. These are just two examples of the many big facilities in the works in the webscale sector.
Who benefits from webscale capex?
The network spending of big webscalers is centered around immense, “hyperscale” data centers and undersea cable systems that support network traffic from the tech companies’ online retail, video, and social media platforms, along with cloud services. Webscale network operators (WNOs) may also own access networks, typically using fiber, microwave or mmWave, and even fixed satellite. WNOs exploring outer space for providing connectivity include Amazon, Apple, Alphabet, Facebook, and Microsoft.
A broad set of vendors are benefiting from WNO capex spending – from semiconductor players selling into the data center market (Intel, AMD, Nvidia, Broadcom, etc), to optical components & transport vendors selling into data center interconnect markets (Ciena, Infinera, Neophotonics, Lumentum, etc.), to contract manufacturers of white box/OCP servers (Wistron and Quanta). Cisco and Ciena, for instance, two important suppliers to the telco market, recorded approximately $945M and $247M in sales to the webscale sector in 2Q21 (MTN Consulting estimates). The construction industry also sees webscale as important, as much of their capex is for development of data center properties.
R&D spending plateaus
The webscale sector’s R&D to revenues ratio has fallen recently, from 10.5% (annualized) in 4Q20 to 10.0% in 2Q21, as revenue growth in 1H21 was dramatic and due in part to M&A and expansion of ecommerce activities. R&D spend will likely pick up later in 2021, as homegrown innovation is central to the strategies of many webscalers. R&D spend involves software development by employees and hardware design and development for both existing product ranges (e.g. Apple’s iPhone) and entirely new lines of business with unproven potential (e.g. connected cars).
Focusing on R&D spending by the Top 8, Facebook is the leader as usual, spending 20.3% of revenues on R&D in 3Q20-2Q21. Baidu is an impressive second, investing heavily in AI and autonomous vehicles. Tencent and Alibaba are near the bottom; they have been rising but government uncertainty may delay some spending. Apple’s tech capex and R&D are both low relative to peers, but in line with typical consumer electronics companies.
FCF margins steady, net margins climbing, cash reserves still healthy
For the webscale market as a whole, free cash flow margins have hovered in the 17-21% range over the last few years. A slight capex surge in 2Q21 caused FCF margins to decline a bit, but only slightly, down to 18.7% (annualized), well within historic averages. Net profit margins have been rising steadily over the last three quarters, reaching 20.7% on an annualized basis in 2Q21.
Cash on hand, including short-term liquid investments, amounted to $762 billion for the webscale sector at the end of 2Q21, up 4% YoY. Total debt rose faster, up 9% YoY in 2Q21, but remains far less at $525B. As a result, net debt (debt minus cash) in June 2021 was -$238B, from -$252B in June 2020. The companies with the biggest stockpiles of cash (and equivalents) are Alphabet and Microsoft, with $136 and $130 billion, respectively.
Forecast outlook
Looking ahead to 2025, we expect webscale revenues and capex to grow to approximately $3.06 trillion and $251 billion, respectively. For 2021, growth to date has already exceeded the forecast update we issued in August 2021. Our revenue forecast from August will almost certainly turn out to be too conservative, absent an economic meltdown. Actual revenues are more likely to be in the $2.1-2.2T range than $2.0T. Capex will also likely come in above our 2021 target of $149B, but will likely outperform at a lower rate than revenues. One uncertainty is Amazon; it is now a big part of the webscale market, and its rapid expansion a big part of recent growth. Logic would dictate that it pull back a bit, but the company provides the market with very limited guidance.
- Table Of Contents
- Figures & Charts
- Coverage
- Visuals
Table Of Contents
- Abstract
- Analysis
- WNO Market: Key Stats thru 2Q21
- Company Drilldown
- Top 8 WNOs
- Company Benchmarking
- Regional Breakouts
- Raw Data
- Exchange Rates
- About
Figures & Charts
- Key Metrics: Growth rates, Annualized 2Q21/2Q20 vs. 2011-20
- WNO Revenues: Single-quarter & annualized (US$M)
- Top 8 WNOs: YoY revenue growth in 2Q21
- Annualized profitability: WNOs
- Free cash flow per employee, 2Q21 annualized (US$)
- FCF Margins vs. Net Margins, 2Q21 annualized
- Advertising revenues as % total (FY2020)
- Annualized capex and R&D spending: WNOs (% revenues)
- WNO capex by type, Annualized: 2Q15-2Q21 (US$M)
- Network & IT capex as share of revenues, 2Q21 annualized
- R&D expenses as % revenues, Top 8 WNOs (2Q21 annualized)
- Acquisition spending vs. capex spending, 2Q15-2Q21 annualized (US$M)
- Net PP&E per employee (US$’ 000) – 2Q21
- Ranking the Webscale Network Operators: Revenues; R&D; Capex; Network & IT capex – 2020 & 2Q21 (US$B)
- Revenues: annual, single-quarter, and annualized (US$M)
- Profitability (Net Profit; Cash from operations; Free cash flow): annual, single-quarter, and annualized (US$M)
- Spending (R&D; M&A; Capex; Network & IT capex; Lease): annual, single-quarter, and annualized (US$M)
- Cash & Short-term Investments: annual and single-quarter (US$M)
- Debt (Total debt; Net debt): annual and single-quarter (US$M)
- Property, Plant & Equipment: annual and single-quarter (US$M)
- Key Ratios: Net margin; R&D/revenues; Capex/revenues; Network & IT capex/revenues; Free cash flow/revenues; Lease costs/revenues – annual and annualized (%)
- Total employees
- Revenue per employee, annualized (US$K)
- FCF per employee, annualized (US$K)
- Net PP&E per employee, annualized (US$K)
- Revenues & Spending (US$M)
- Webscale Business Mix by Revenues (FY2020) – MTN Consulting estimates
- Top 10 recent acquisitions & investments
- Revenues (US$M) & YoY revenue growth (%), single-quarter: by company
- Revenues, annualized (US$M): by company
- Annualized profitability margins: by company
- Annualized capex and capital intensity: by company
- Annualized capex and R&D spending as % of revenues: by company
- Share of WNO network & IT capex, Annualized: by company
- Total employees: by company
- Annualized per-employee metrics (US$000s): by company
- Net debt (debt minus cash & stock) (US$M): by company
- 2011 vs. 2020: company benchmark by KPI (Revenues, R&D, Net profit, Cash from operations, Capex, Free cash flow, Cash & short-term investments, Net PP&E, Total debt)
- 2011 vs. 2020: company benchmark by key ratio (Capex/revenues; R&D/revenues; Net margin; FCF margin)
- Top 8 WNO’s share vs. Rest of the market: by KPI (Revenues, R&D, Net profit, Cash from operations, Capex, Free cash flow, Cash & short-term investments, Net PP&E, Total debt)
- Top 8 WNOs benchmarking by Key ratio: Capex/revenues; R&D/revenues; Net margin; FCF margin)
- Total WNO Market Revenues, by region: Latest CY; Latest Quarter; Annual trend (2011-20); Single quarter (2Q14-2Q21)
- Regional revenues by operator: Latest CY; Latest Quarter; Annual trend (2011-20); Single quarter (2Q14-2Q21)
- Top 10 operators by region: Latest CY; Latest Quarter
Coverage
| Top 8 WNOs | |||
| Alibaba | Alphabet | Amazon | Apple |
| Baidu | Microsoft | Tencent | |
| Other WNOs | |||
| Altaba | ChinaCache | Cognizant | eBay |
| Fujitsu | HPE | IBM | JD.com |
| Oracle | SAP | Yandex | |
Visuals