By Matt Walker
Webscale surges to $1.84 trillion in revenues, on par with the telecom sector
The webscale sector’s growth accelerated in 2020. The sudden, widespread need to work and study from home increased demand for the cloud services offered by many webscale players. The need for social distance caused an uptick in usage of social media platforms such as those offered by Facebook. Online shopping was a prime beneficiary of pandemic-related lifestyle changes. Even though the pandemic has eased in many countries, webscale growth remained vigorous in 1Q21. Annualized revenues surged 23.7% YoY in 1Q21 to hit $1.84 trillion. That is a bit more than the $1.83 trillion recorded by the global telecom operator sector in the same time period. This is the first time webscale has exceeded telecom at the top line.
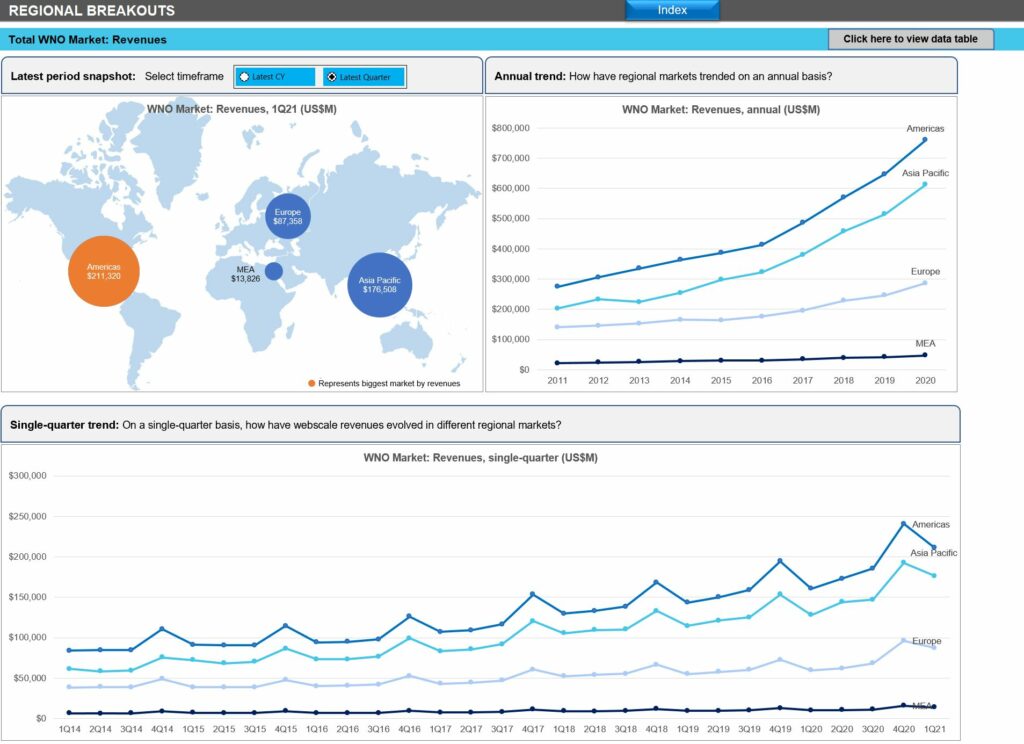
Americas remain the largest regional market, but Europe grew faster in 1Q21
All regions saw significant growth in 1Q21. The Americas region remains the world’s largest webscale region, accounting for 43.2% of 1Q21 revenues, ahead of Asia’s 36.1%. Europe was the dominant region in 1Q21, however, on a growth rate basis. Europe’s webscale revenues in 1Q21 totaled $87.4B, up 47% YoY, well ahead of Asia, which took second place with 38% YoY growth. The MEA market remains the smallest of the four regions, but its 37% growth rate outpaced the Americas in 1Q21. Further, several cloud providers are building out capacity in the MEA market, and the region’s subsea cable connectivity is improving, so faster growth is likely on the way for MEA.
Annualized capex grew 29% YoY in 1Q21
While COVID-19 depressed the telco sector in 2020, strong demand for cloud services and ecommerce drove the webscale operators providing these services to expand investments considerably. The last four quarters, 2Q20-1Q21, have seen annualized capex reach new all-time highs. Annualized capex ended 1Q21 at $141.5B, up 29.0% from 1Q20. The non-tech piece of capex amounted to $61B, or 57% of the total, but grew much more slowly than Network capex in 1Q21. That’s different than 2020 overall, when “Other” capex surged as ecommerce providers invested in logistics, and cloud spending targeted property more than servers and software.
Capital intensity rose throughout 2020, ending the year at 7.8%, but stepped back a bit in 1Q21 to 7.7% on an annualized basis. That’s because some of the webscale sector’s top-line growth is driven by activities which don’t require significant network investments; ecommerce, notably. In addition, some webscale providers have chosen capex-light strategies where they have some of their own data centers but also rely on the facilities of larger providers like AWS, Azure, and GCP; Apple is one example.
The network/IT/software portion of capex in the 1Q21 annualized period was lower than expected, just 43%. That is partly because of methodology changes in how MTN Consulting estimates the tech portion of webscale capex. Going forward, we expect the non-tech portion of webscale capex to remain well below 50% as a spate of new data centers are constructed in the 2021-22 period, but begin to grow towards 50% by 2025, as more of capex is for server/capacity expansion of existing infrastructure. Within the technology piece of capex, data centers and their components (networking, compute, storage, power) will soak up the bulk of spending, but subsea cables and satellite networks will become increasingly important over the next 5 years.
Who benefits from webscale capex?
The network spending of big webscalers is centered around immense, “hyperscale” data centers and undersea cable systems that support network traffic from the tech companies’ online retail, video, and social media platforms, along with cloud services. Webscale network operators (WNOs) may also own access networks, typically using fiber, microwave or mmWave, and even fixed satellite. WNOs exploring outer space for providing connectivity include Amazon, Apple, Alphabet, Facebook, and Microsoft.
A broad set of vendors are benefiting from WNO capex spending – from semiconductor players selling into the data center market (Intel, AMD, Nvidia, Broadcom, etc), to optical components & transport vendors selling into data center interconnect markets (Ciena, Infinera, Neophotonics, Lumentum, etc.), to contract manufacturers of white box/OCP servers (Wistron and Quanta).
R&D spending plateaus
The webscale sector’s R&D to revenues ratio fell quite a bit in 1Q21 as revenue growth was dramatic and due in part to M&A and expansion of ecommerce activities. R&D spend will likely pick up later in 2021, as homegrown innovation is central to the strategies of many webscalers. R&D spend involves software development by employees and hardware design and development for both existing product ranges (e.g. Apple’s iPhone) and entirely new lines of business with unproven potential (e.g. connected cars).
Focusing on R&D spending by the Top 8, Facebook is the leader as usual, spending 20.8% of revenues on R&D in 2Q-20-1Q21. Baidu is an impressive second, investing heavily in AI and autonomous vehicles. Tencent and Alibaba are near the bottom, but rising under government pressure. Apple’s tech capex and R&D spending patterns are both low relative to peers, and more in line with a consumer electronics company than a software company.
Average profitability remains high
As the webscale sector’s topline has surged during the pandemic, the sector’s bottom line profitability has also risen. The sector’s average net profit margin rose from 17.2% in 2019 to 18.1% in 2020, while average free cash flow margin increased from 18.9% to 19.8%. In 1Q21, net margins continued to rise, but free cash flow margins took a slight step back due to high capex spending.
Several of the webscale sector’s key players face regulatory threats, notably Alibaba and Tencent in China, and Alphabet, Facebook, and Amazon in the US. Government and court actions are moving glacially slow in the US, and the sector has benefited from COVID-19’s acceleration of digital transformation and adoption of cloud services. However, public concerns about abuses of privacy, facilitation of fake news, and monopolistic or (at the least) oligopolistic behavior will make it nearly impossible for these companies to stem the increased oversight likely to come soon from policymakers.
It’s a slightly different story in China, where the government actively curtailed Alibaba’s efforts to penetrate the financial services sector late last year. Also, Tencent confirmed in late March 2021 that it has been talking to antitrust authorities in China, on a voluntary basis, in part because of its numerous acquisitions over the last few years. Clearly the Chinese government doesn’t want these providers to get so big as to be uncontrollable, or become threats to the ruling party, but government infrastructure investment targets are heavily dependent on the cooperation of these two private sector companies.
Cash on hand, including short-term liquid investments, amounted to $730 billion for the webscale sector at the end of 1Q21, up 10% YoY. Total debt was less, ending 1Q21 at $486 billion, up by roughly the same 10% YoY rate versus1Q20. Net debt in March 2021 was -$244.1B, from -$224.5B in March 2020.
Spending forecast outlook
For the webscale sector, total capex in 2020 exceeded our forecast. We expected $122B, but the actual was $133B. By contrast, the actual Network/IT portion of capex in 2020 was a bit less than we expected ($56B v. $61B). Our official forecast target for Network/IT capex in 2021 is $68.7B. In 1Q21, Network/IT capex was $15.4B, or about 22% of the full-year target. Based on progress to date and company guidance, we are retaining our full-year 2021 capex forecast for the webscale sector.
Several webscalers have published guidance for capex in 2021, and most of these predict growth; Facebook in particular is expecting a big year after it paused several projects in 2020. Alphabet has similar guidance: “we expect a return to a more normalized pace of ground-up construction and fit-out of office facilities, which translates into a sizable increase in CapEx in 2021. Servers will continue to be the largest driver of spend on technical infrastructure.” Alibaba and Tencent are likely to accelerate spending after a period of regulatory uncertainty, and as pressure from the government to meet infrastructure targets kicks in again. Amazon has not provided guidance. We expect Amazon’s overall capex growth rates to moderate significantly during the year, but the Network/IT portion of total capex to rise. In fact, other companies may see the same thing, due in part to COVID-19 lowering the need to spend capex on office buildings. For instance, Alphabet notes its office facilities will have “less density per employee” going forward due to the move to a “hybrid work environment”.
*
Deliverable format: Excel.
- Table Of Contents
- Figures & Charts
- Coverage
- Visuals
Table Of Contents
- Abstract
- Analysis
- WNO Market: Key Stats thru 1Q21
- Company Drilldown
- Top 8 WNOs
- Company Benchmarking
- Regional Breakouts
- Raw Data
- Exchange Rates
- About
Figures & Charts
- Key Metrics: Growth rates, Annualized 1Q21/1Q20 vs. 2011-20
- WNO Revenues: Single-quarter & annualized (US$M)
- Top 8 WNOs: YoY revenue growth in 1Q21
- Annualized profitability: WNOs
- Free cash flow per employee, 1Q21 annualized (US$)
- FCF Margins vs. Net Margins, 1Q21 annualized
- Advertising revenues as % total (FY2020)
- Annualized capex and R&D spending: WNOs (% revenues)
- WNO capex by type, Annualized: 1Q15-1Q21 (US$M)
- Network & IT capex as share of revenues, 1Q21 annualized
- R&D expenses as % revenues, Top 8 WNOs (1Q21 annualized)
- Acquisition spending vs. capex spending, 1Q15-1Q21 annualized (US$M)
- Net PP&E per employee (US$’ 000) – 1Q21
- Ranking the Webscale Network Operators: Revenues; R&D; Capex; Network & IT capex – 2020 & 1Q21 (US$B)
- Revenues: annual, single-quarter, and annualized (US$M)
- Profitability (Net Profit; Cash from operations; Free cash flow): annual, single-quarter, and annualized (US$M)
- Spending (R&D; M&A; Capex; Network & IT capex; Lease): annual, single-quarter, and annualized (US$M)
- Cash & Short-term Investments: annual and single-quarter (US$M)
- Debt (Total debt; Net debt): annual and single-quarter (US$M)
- Property, Plant & Equipment: annual and single-quarter (US$M)
- Key Ratios: Net margin; R&D/revenues; Capex/revenues; Network & IT capex/revenues; Free cash flow/revenues; Lease costs/revenues – annual and annualized (%)
- Total employees
- Revenue per employee, annualized (US$K)
- FCF per employee, annualized (US$K)
- Net PP&E per employee, annualized (US$K)
- Revenues & Spending (US$M)
- Webscale Business Mix by Revenues (FY2020) – MTN Consulting estimates
- Top 10 recent acquisitions & investments
- Revenues (US$M) & YoY revenue growth (%), single-quarter: by company
- Revenues, annualized (US$M): by company
- Annualized profitability margins: by company
- Annualized capex and capital intensity: by company
- Annualized capex and R&D spending as % of revenues: by company
- Share of WNO network & IT capex, Annualized: by company
- Total employees: by company
- Annualized per-employee metrics (US$000s): by company
- Net debt (debt minus cash & stock) (US$M): by company
- 2011 vs. 2020: company benchmark by KPI (Revenues, R&D, Net profit, Cash from operations, Capex, Free cash flow, Cash & short-term investments, Net PP&E, Total debt)
- 2011 vs. 2020: company benchmark by key ratio (Capex/revenues; R&D/revenues; Net margin; FCF margin)
- Top 8 WNO’s share vs. Rest of the market: by KPI (Revenues, R&D, Net profit, Cash from operations, Capex, Free cash flow, Cash & short-term investments, Net PP&E, Total debt)
- Top 8 WNOs benchmarking by Key ratio: Capex/revenues; R&D/revenues; Net margin; FCF margin)
- Total WNO Market Revenues, by region: Latest CY; Latest Quarter; Annual trend (2011-20); Single quarter (1Q14-1Q21)
- Regional revenues by operator: Latest CY; Latest Quarter; Annual trend (2011-20); Single quarter (1Q14-1Q21)
- Top 10 operators by region: Latest CY; Latest Quarter
Coverage
| Top 8 WNOs | |||
| Alibaba | Alphabet | Amazon | Apple |
| Baidu | Microsoft | Tencent | |
| Other WNOs | |||
| Altaba | ChinaCache | Cognizant | eBay |
| Fujitsu | HPE | IBM | JD.com |
| Oracle | SAP | Yandex | |
Visuals