By Arun Menon and Matt Walker
MTN Consulting’s 1Q20 WNO Market Review analyzes the network infrastructure spending and financial position of webscale network operators (WNOs).
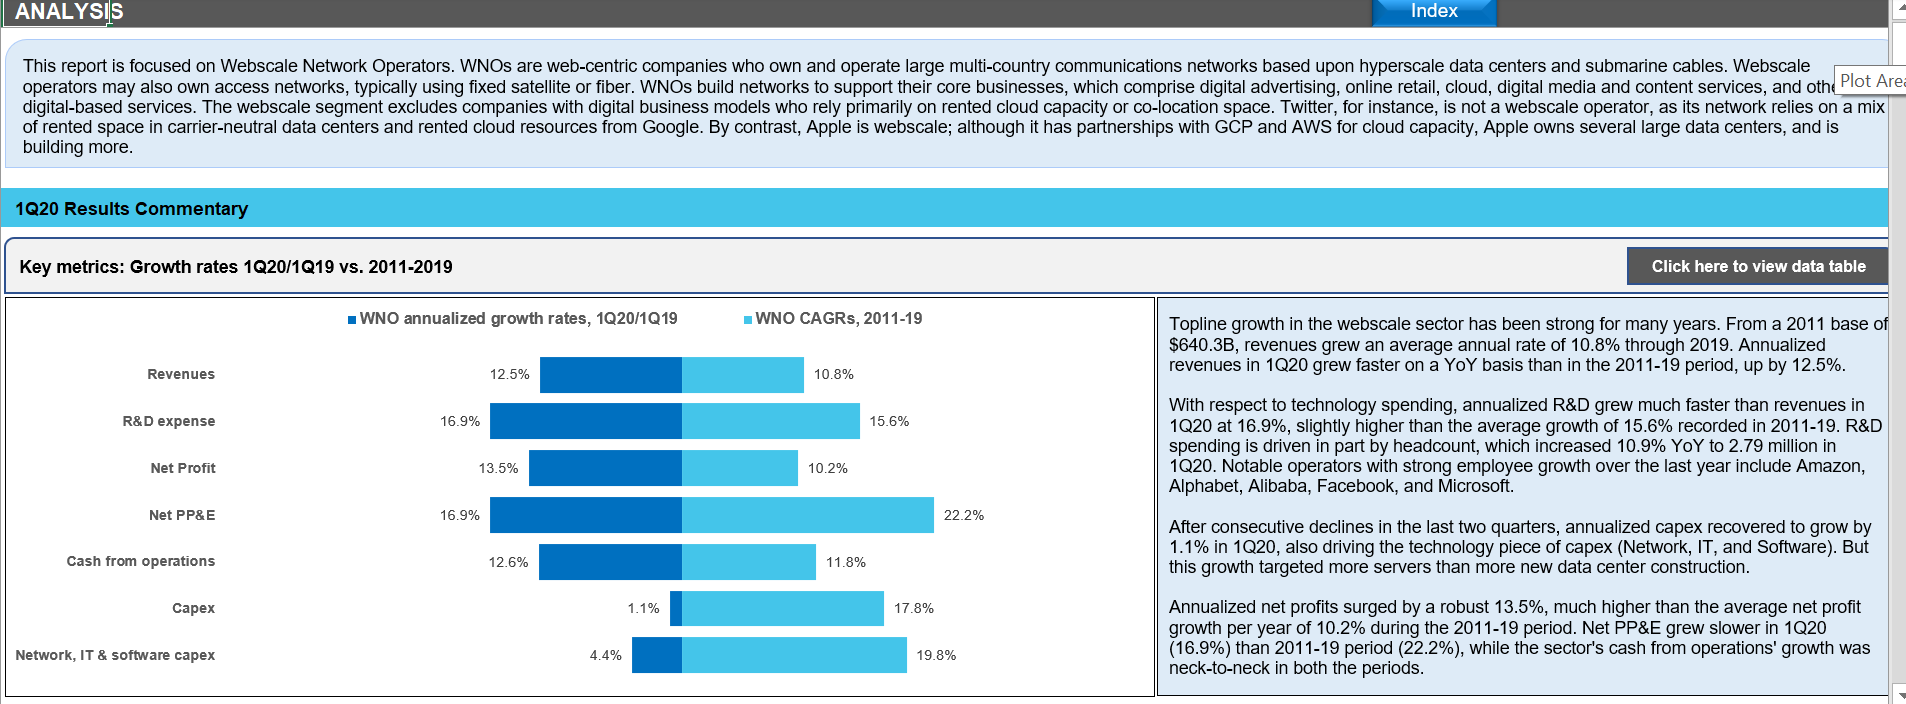
WNOs are web-centric companies who own and operate large multi-country communications networks based upon hyperscale data centers and submarine cables. Webscale operators may also own access networks, typically using fixed satellite or fiber. WNOs own network assets in order to support their core businesses, which comprise digital advertising, online retail, cloud, digital media and content services, and other digital-based services. The webscale segment excludes companies with digital business models who rely primarily on rented cloud capacity or colocation space. Twitter, for instance, is not a webscale operator, as its network relies on a mix of rented space in carrier-neutral data centers and rented cloud resources from Google. By contrast, Apple is webscale; although it has partnerships with GCP and AWS for cloud capacity, Apple owns several large data centers, and is building more.
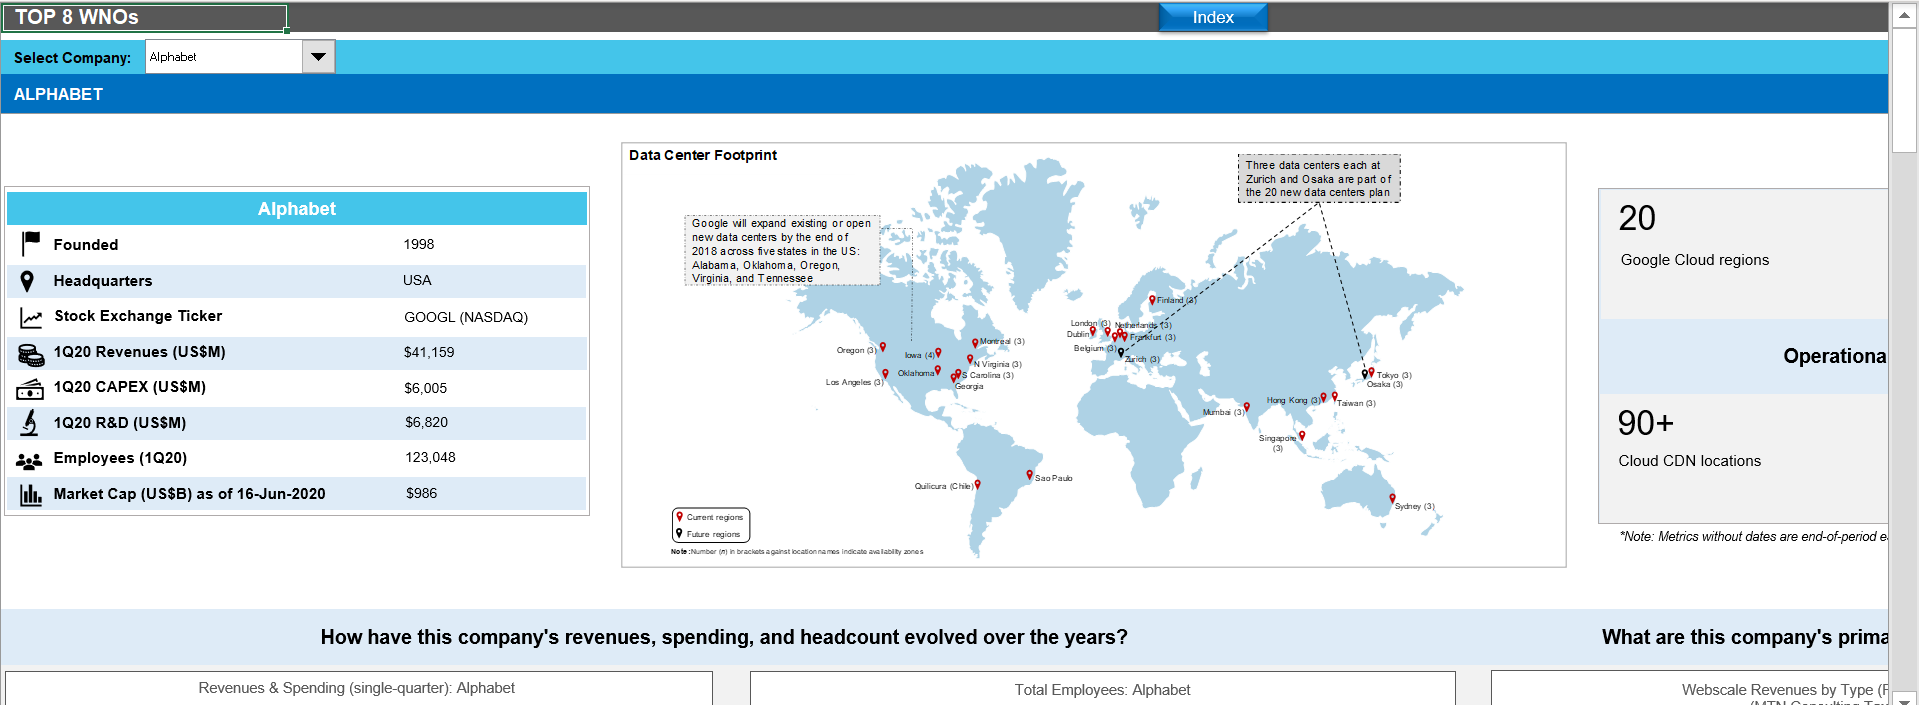
WNOs tracked in this report include the “Top 8” companies (Alibaba, Alphabet, Amazon, Apple, Baidu, Facebook, Microsoft, and Tencent) and 12 others: Altaba, ChinaCache, Cognizant, eBay, Fujitsu, HPE, IBM, JD.COM, LinkedIn, Oracle, SAP, Yandex.
- Table Of Contents
- Figures & Charts
- Visuals
Table Of Contents
- Abstract
- Analysis
- WNO Market: Key Stats thru 1Q20
- Company Drilldown
- Top 8 WNOs
- Company Benchmarking
- Regional Breakouts
- Raw Data
- Exchange Rates
- About
Figures & Charts
- Key Metrics: Growth rates, Annualized 1Q20/1Q19 vs. 2011-19
- WNO Revenues: Single-quarter & annualized (US$M)
- Top 8 WNOs: YoY revenue growth in 1Q20
- Annualized profitability: WNOs
- Free cash flow per employee, 1Q20 annualized (US$)
- FCF Margins vs. Net Margins, 1Q20 annualized
- Advertising revenues as % total (FY2019)
- Annualized capex and R&D spending: WNOs (% revenues)
- WNO capex by type, Annualized: 1Q15-1Q20 (US$M)
- Network & IT capex as share of revenues, 1Q20 annualized
- R&D expenses as % revenues, Top 8 WNOs (1Q20 annualized)
- Acquisition spending vs. capex spending, 1Q14-1Q20 annualized (US$M)
- Net PP&E per employee (US$’ 000) – 1Q20
- Ranking the Webscale Network Operators: Revenues; R&D; Capex; Network & IT capex – 2019 & 1Q20 (US$B)
- Revenues: annual, single-quarter, and annualized (US$M)
- Profitability (Net Profit; Cash from operations; Free cash flow): annual, single-quarter, and annualized (US$M)
- Spending (R&D; M&A; Capex; Network & IT capex; Lease): annual, single-quarter, and annualized (US$M)
- Cash & Short-term Investments: annual and single-quarter (US$M)
- Debt (Total debt; Net debt): annual and single-quarter (US$M)
- Property, Plant & Equipment: annual and single-quarter (US$M)
- Key Ratios: Net margin; R&D/revenues; Capex/revenues; Network & IT capex/revenues; Free cash flow/revenues; Lease costs/revenues – annual and annualized (%)
- Total employees
- Revenue per employee, annualized (US$K)
- FCF per employee, annualized (US$K)
- Net PP&E per employee, annualized (US$K)
- Revenues & Spending (US$M)
- Webscale Business Mix by Revenues (FY2018) – MTN Consulting estimates
- Top 10 recent acquisitions & investments
- Revenues (US$M) & YoY revenue growth (%), single-quarter: by company
- Revenues, annualized (US$M): by company
- Annualized profitability margins: by company
- Annualized capex and capital intensity: by company
- Annualized capex and R&D spending as % of revenues: by company
- Share of WNO network & IT capex, Annualized: by company
- Total employees: by company
- Annualized per-employee metrics (US$000s): by company
- Net debt (debt minus cash & stock) (US$M): by company
- 2011 vs. 2019: company benchmark by KPI (Revenues, R&D, Net profit, Cash from operations, Capex, Free cash flow, Cash & short-term investments, Net PP&E, Total debt)
- 2011 vs. 2019: company benchmark by key ratio (Capex/revenues; R&D/revenues; Net margin; FCF margin)
- Top 8 WNO’s share vs. Rest of the market: by KPI (Revenues, R&D, Net profit, Cash from operations, Capex, Free cash flow, Cash & short-term investments, Net PP&E, Total debt)
- Top 8 WNOs benchmarking by Key ratio: Capex/revenues; R&D/revenues; Net margin; FCF margin)
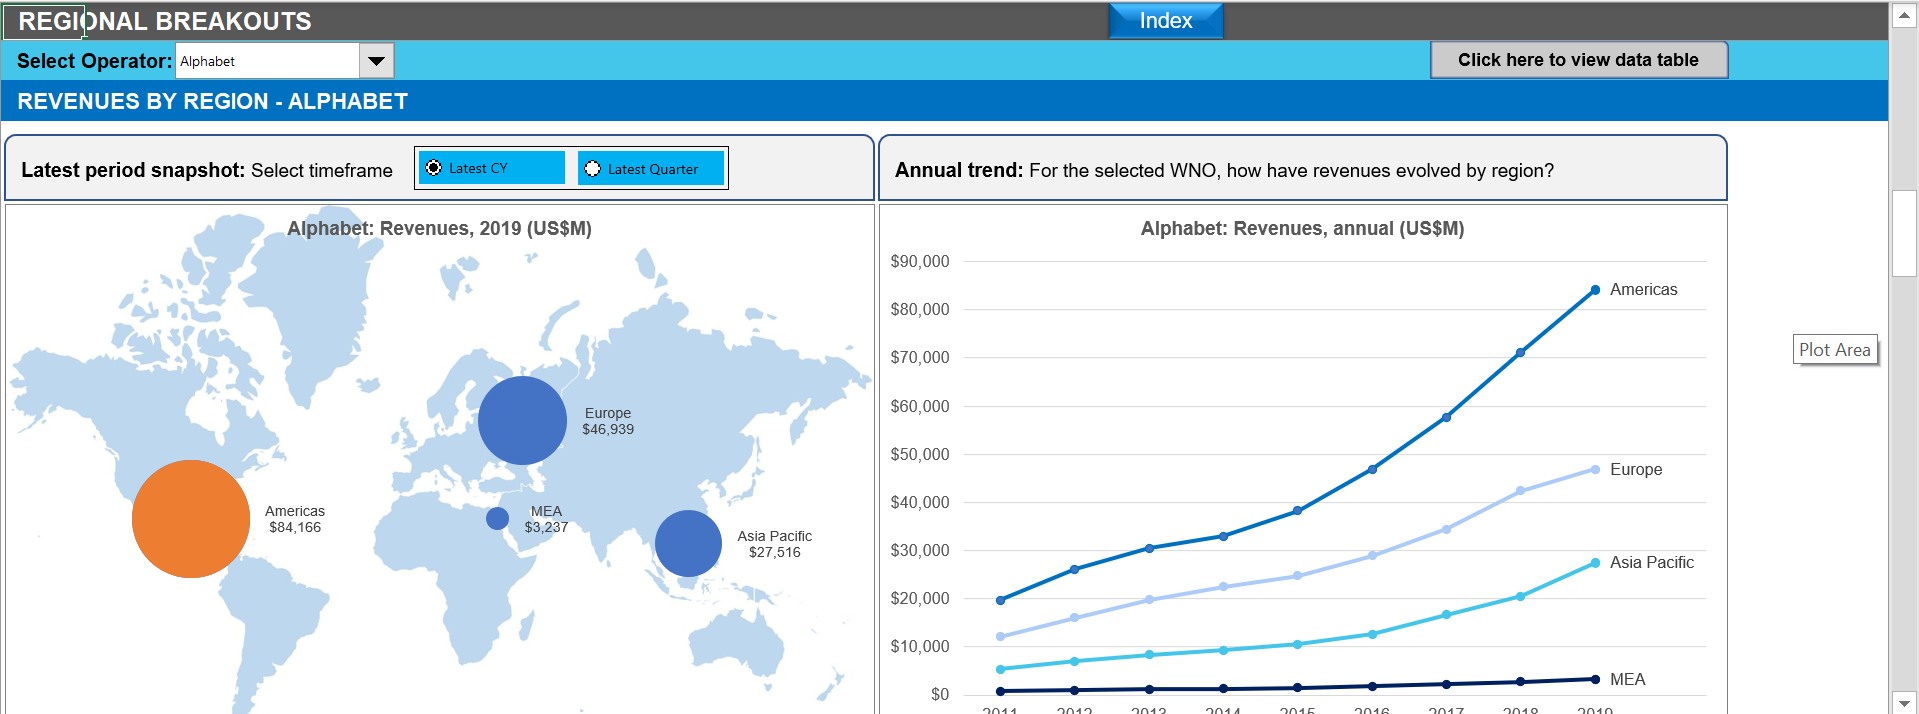
- Total WNO Market Revenues, by region: Latest CY; Latest Quarter; Annual trend (2011-19); Single quarter (1Q14-1Q20)
- Regional revenues by operator: Latest CY; Latest Quarter; Annual trend (2011-19); Single quarter (1Q14-1Q20)
- Top 10 operators by region: Latest CY; Latest Quarter
Visuals