By Matt Walker
The global telecom industry bounced back in 4Q20 with 3.4% and 1.2% YoY growth in revenues and capex, respectively. Revenues for CY2020 declined 1.1% to $1.794 trillion. This is not exactly a sign of 5G stimulating market demand, but reassuring relative to the 5.4% YoY revenue decline recorded during the worst quarter of the pandemic’s spread, 2Q20. Total industry capex for 2020 was $294.1 billion, down 1.8% YoY, due in part to a 7.3% surge in China as a government push accelerated 5G rollouts. Japan was also a highlight due to Rakuten, NTT and KDDI. The biggest capex declines in 2020 occurred at AT&T, Jio, America Movil, Telefonica, and Vodafone Idea. The reductions at Jio and VI illustrate a common telco predicament: the need to restrain network capex to cope with expensive spectrum costs.
The relationship between capex and revenues in the telecom industry has stabilized, with annualized capital intensity remaining in a narrow window around 16.5% for several years. 2020’s figure was 16.4%. This outperforms the 16.0% MTN Consulting expected for 2020, but we still expect average capex/revenues to glide towards the 15% range by 2025. That is just an average; individual telcos continue to record a wide range of capital intensity metrics, from the low single digits to an extreme of 148.2%, for Rakuten.
In the M&A world, the biggest industry change in 2020 was the completion of Deutsche Telekom’s acquisition of Sprint. This has pushed DT into a leadership position in the industry, as it recorded $6.5B in 4Q20 capex, exceeding even China Mobile’s second-ranked $6.0B. Expect DT to exert a stronger influence on industry standards and vendors’ product decisions going forward. Also, the company’s now larger exposure to the US market will tend to make it more sympathetic to the growing global reluctance to use Chinese vendors’ gear. After DT and CM, the biggest spenders in terms of 4Q20 capex were AT&T, NTT, Verizon, China Telecom, Comcast, Vodafone, Orange, and China Unicom. This pecking order is largely unchanged from recent periods, where the top few operators in the US, China, and Europe dominate rankings.
Relative to company size, the biggest spenders among major telcos in 4Q20 were Telecom Italia, Veon, Rostelecom, Ooredoo, CK Hutchison, and Iliad. All recorded capital intensity above 30% on a single quarter basis. The transition to 5G is not the only factor. Costly fiber deployments were an issue for Iliad and Telecom Italia. Veon spent heavily on scaling up 4G across its footprint. Rostelecom’s core capex is supplemented by state program investments; the company’s share capital is 38% owned by the Federal Agency for State Property Management. For Ooredoo and CK Hutchison, 5G was the main driver; CK Hutchison has already made adjustments to its capex burden by agreeing to sell its European towers to Cellnex. One cost driver for many of the big telcos with high capex burdens is the growing cost of developing and/or acquiring software. MTN Consulting expects software to account for a rising percentage of overall network investments over the next few years.
For 2021 we maintain our current outlook: $1,791B in revenues and $292B in capex for the telecom industry, for an average capital intensity of 16.3%. Capex may trend to the high side of this target, however. One uncertainty around our 2021 capex forecast is how telcos’ expanding commercial relationships with the webscale/cloud sector are impacting network spending. Many purchases of cloud resources flow through opex, but there is growing evidence that telcos book many such purchases as capex when possible. The accounting rules are in some cases open to interpretation, even if auditing firms frequently examine cloud cost allocation. An additional uncertainty is Huawei: as it struggles to win contracts amidst supply chain limitations, how will this affect the price bids offered by Nokia and Ericsson? MTN Consulting’s current view is the impact will be minimal, given pressure from a rising Samsung and momentum behind Open RAN architectures. But both factors need to be watched closely.
- Table Of Contents
- Figures
- Coverage
- Visuals
Table Of Contents
Summary – page 2
Telco revenues end 2020 just below $1.8 trillion mark – page 3
Telecom industry capex grows 1.2% YoY in 4Q20 – page 5
Outlook – page 8
Appendix – page 10
Figures
Figure 1: Telecom industry revenues and capital intensity, 2011-20
Figure 2: Top 25 telcos in 4Q20 by revenues (US$B)
Figure 3: Biggest changes in revenues from 4Q19 to 4Q20 (US$M)
Figure 4: YoY change in telecom industry capex, 1Q18-4Q20
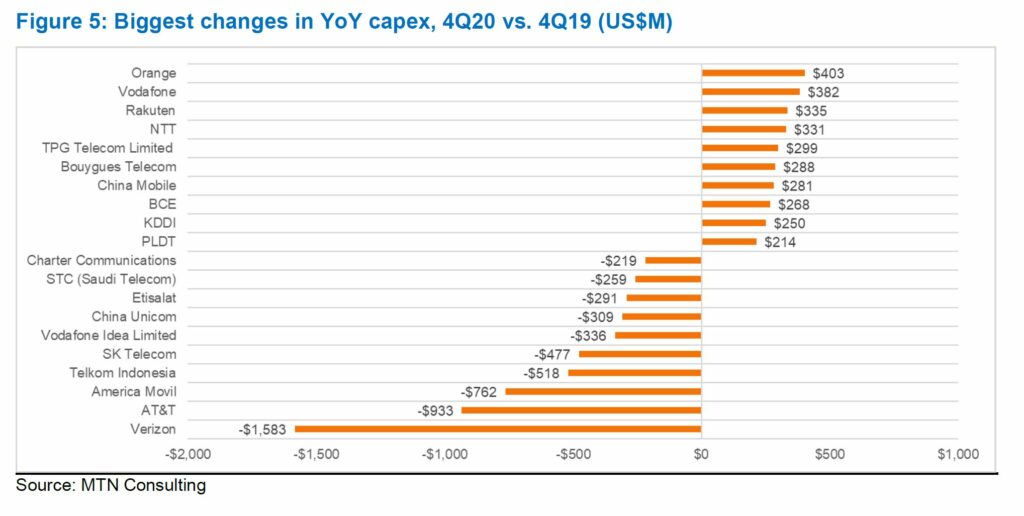
Figure 5: Biggest changes in YoY capex, 4Q20 vs. 4Q19 (US$M)
Figure 6: Top 20 telcos in 4Q20 by capex (US$M)
Figure 7: Highest capital intensity among major telcos in 4Q20*
Coverage
Companies and organizations mentioned in this report include:
Airtel
Altice Europe
Amazon Web Services
America Movil
AT&T
BCE
Boost Mobile
Bouygues Telecom
BT
Cellnex
Charter Communications
China Mobile
China Telecom
China Unicom
CK Hutchison
Comcast
Deutsche Telekom
Dish Network
Ericsson
Etisalat
Google Cloud Platform
Huawei
Iliad
Jio
KDDI
KPN
KT
Microsoft Azure
NEC
Nokia
NTT
Ooredoo
Orange
Rakuten
Rostelecom
Samsung
SK Telecom
Softbank
Sprint
STC
Swisscom
Tele2
Telefonica
Telkom Indonesia
Telstra
TPG Telecom
Turkcell
Veon
Verizon
Vodafone
Vodafone Hutchison Australia
Vodafone Idea
Visuals