By Matt Walker
Swisscom is Switzerland’s incumbent telco, 51% owned by the Swiss government. Its telco operations are in Switzerland and Italy. In 2020, total revenues were $11.8B, up 2.7% from 2019. Swisscom’s 2020 capex was $2.3B, roughly the same as 2019. The company’s capital intensity in 2020 was 19.6%, comfortably above the global average, and in line with a company with a large base of fixed subscribers in a challenging geography for network construction. In 2020, the company was ranked 10 in Europe based on revenues and 9 based on capex. Globally, it is the 31st largest telco based on 2020 revenues.
Strategy
Swisscom’s guiding strategy is to “hold its own” in its competitive core business and conquer new growth areas. To support its corporate strategy, Swisscom aims to have the best performing infrastructure in its operating markets (lowest latency, highest speed), best coverage, and best reliability (based on NPS scores). Continuous optimization of its cost base is key for Swisscom, as the company aims to simplify its multiple networks, drive efficiency through automation and lower cost per bit platforms, and push digital transformation across its operations. High labor costs are one reason for the interest in automation.
Network spending
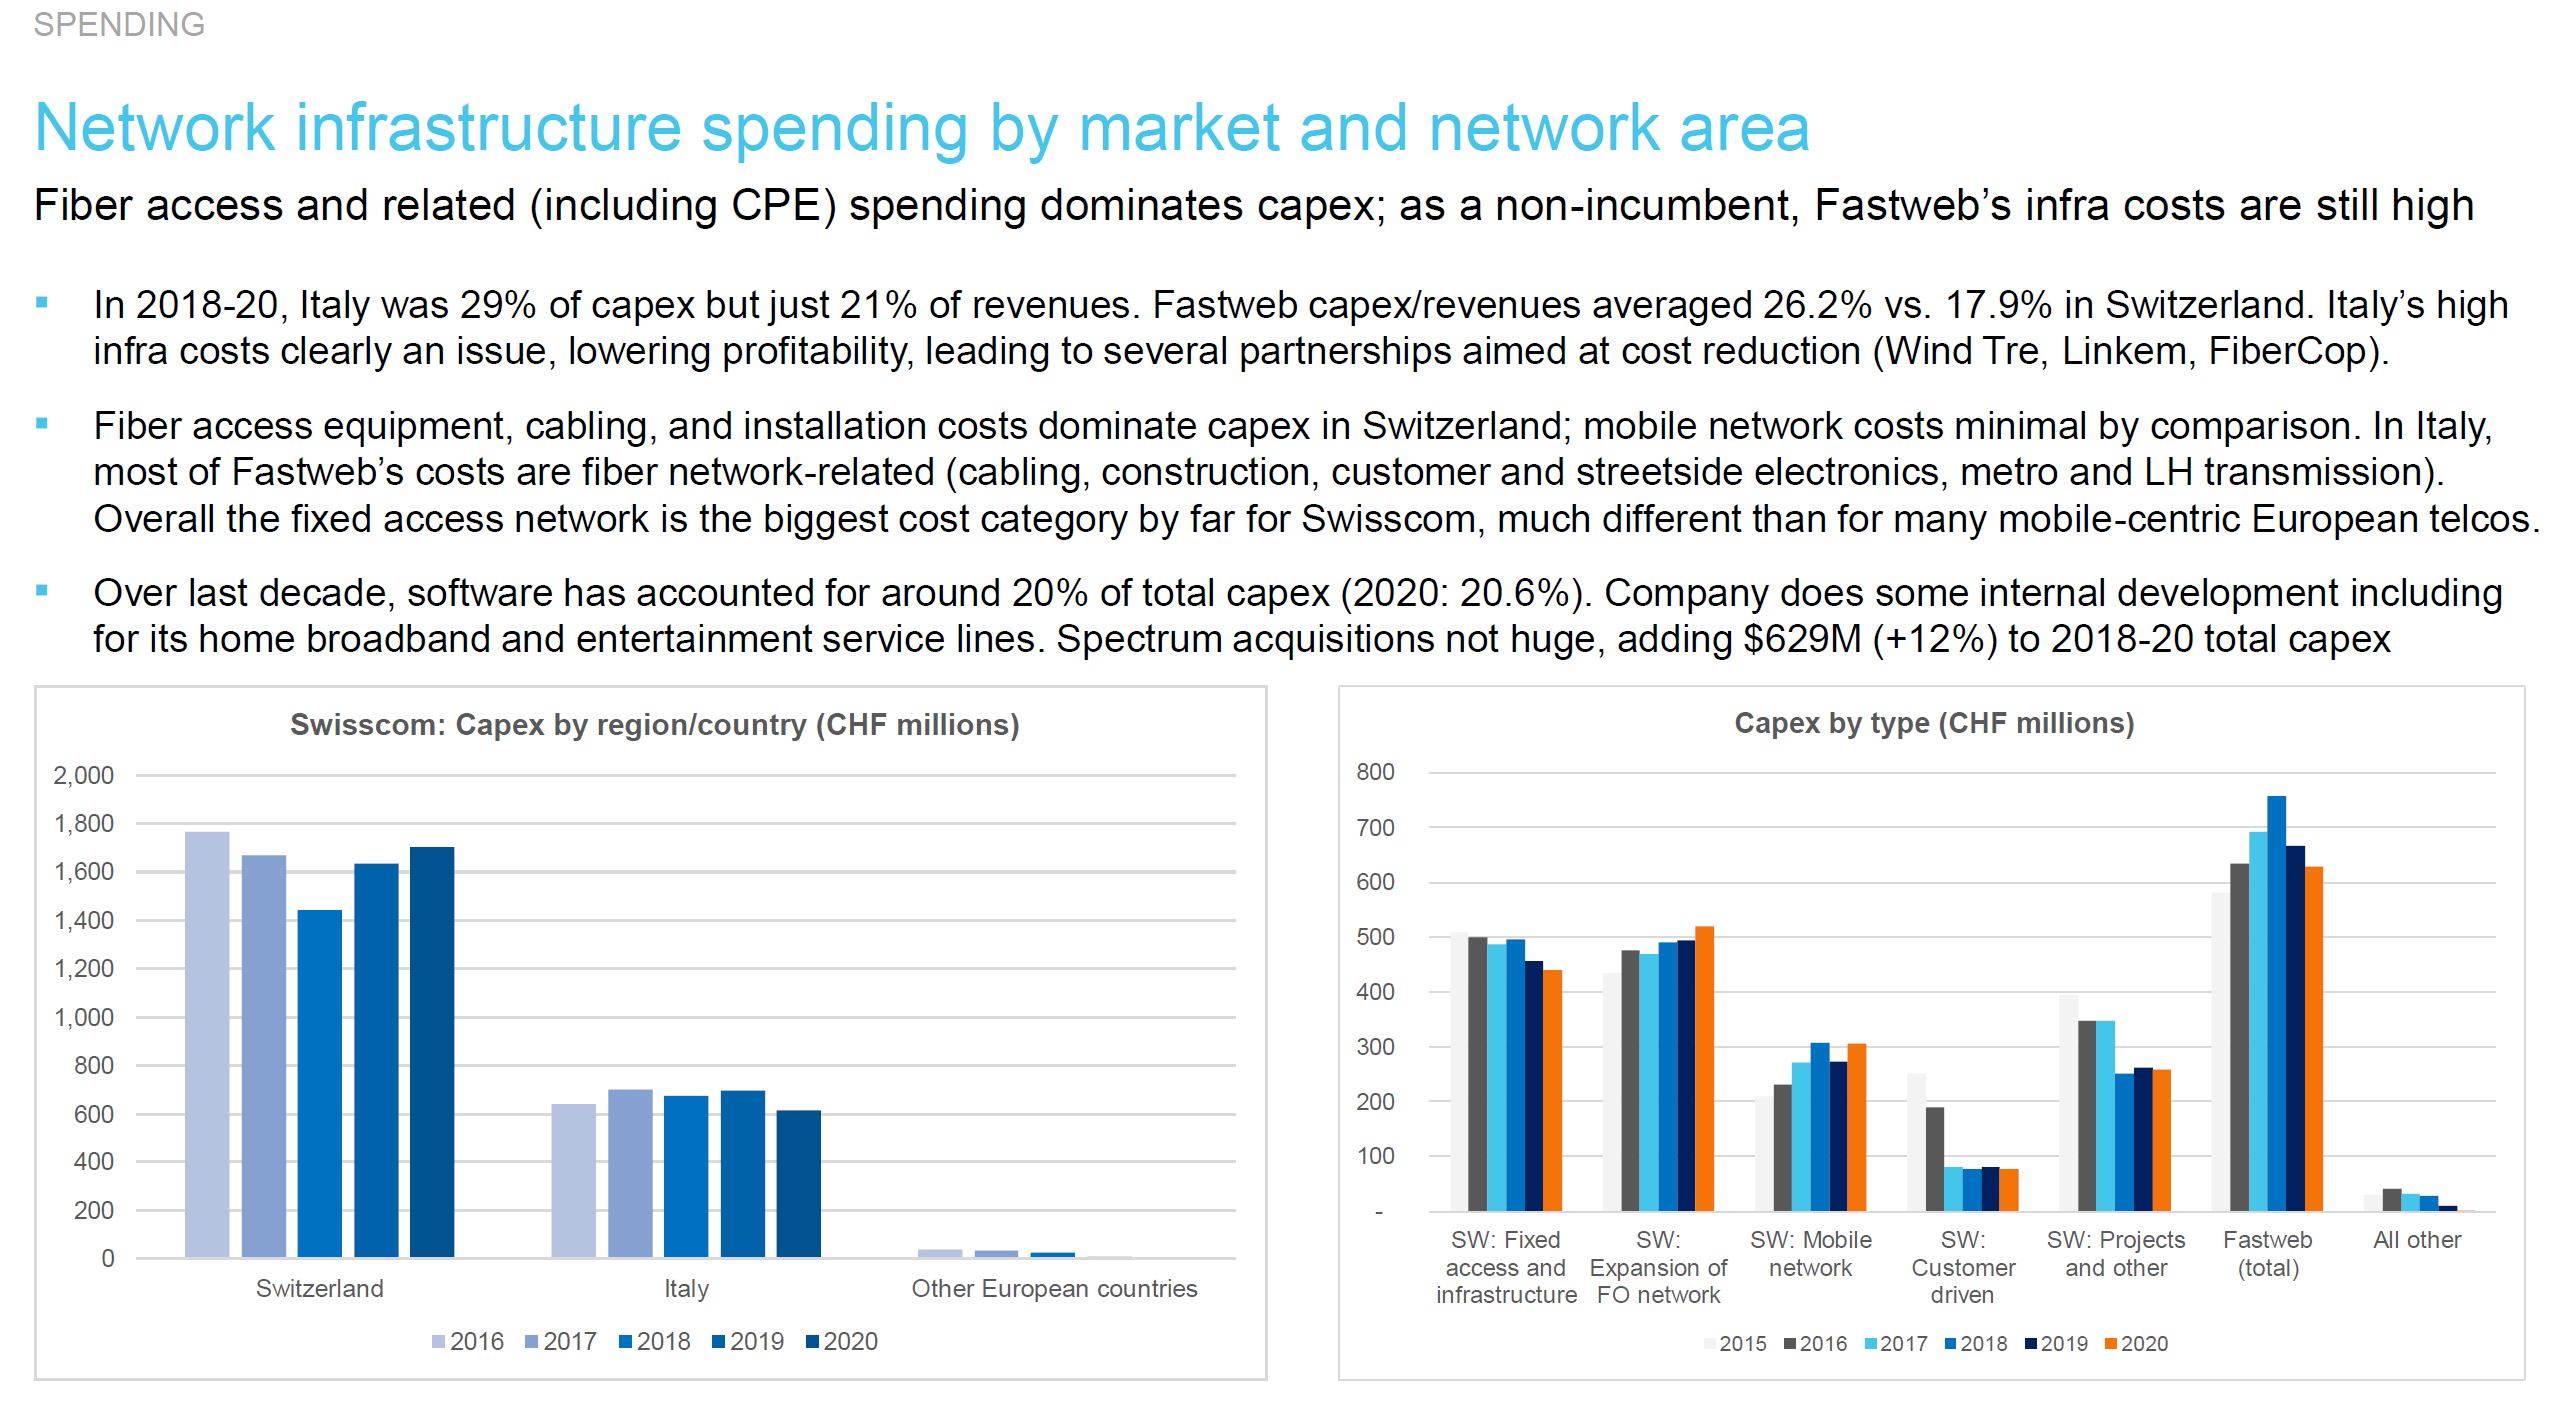
Swisscom runs a large integrated wireline-wireless network in Switzerland, a wireline network in Italy which is expanding into 5G (mobile and FWA), and data centers (6 in Switzerland, 4 in Italy). It retains ownership of its cell tower infrastructure. In Switzerland, it is beginning to explore joint construction or financing partnerships for FTTH, and its Fastweb division in Italy is a partner in the wholesale fiber access controlled by TIM known as FiberCop.
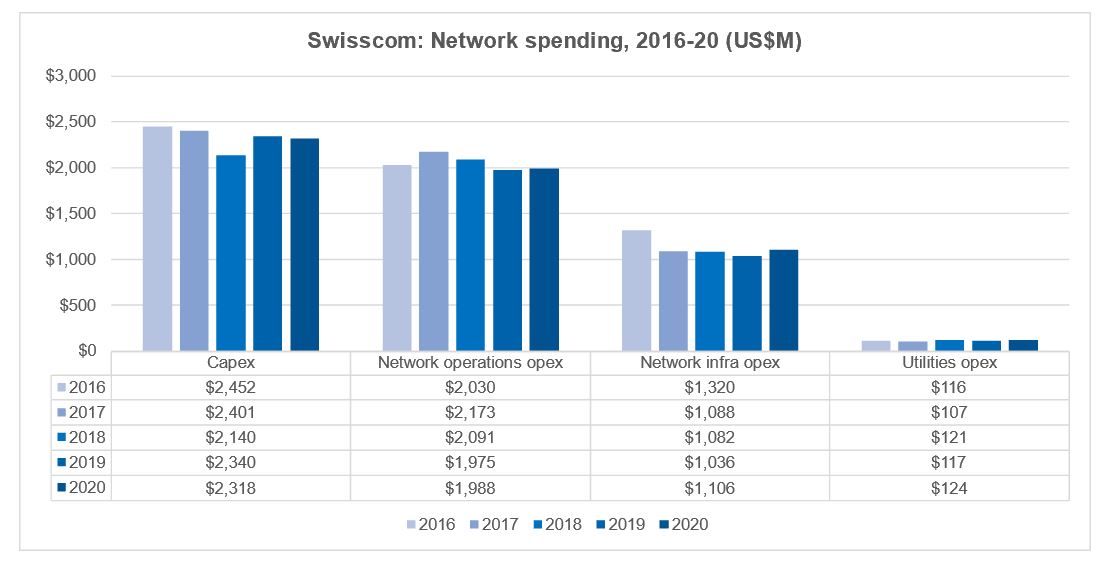
Capex: Swisscom’s spending on network includes between $2.1 and $2.5B in capex over the last five years. Its lowest capital intensity was 17.9% in 2018 but it’s usually around 20%. Swiss operations are lower than this, Fastweb much higher. Spectrum would add 12% to capex if included, based on the 2018-20 average.
Opex: total opex (excluding D&A) averaged to 61.4% of revenues in the last three years, roughly three times capex. Network operations (netops), network infra (leasing/rental/access), and utilities accounted for 29%, 16%, and 1.8% of total opex (ex-D&A) in 2020. The high level of netops is due largely to expensive local staff, and prevalence of fixed access in networks, which are notoriously more costly to maintain. One goal of deep fiber is lower maintenance costs. Energy costs are low, and Swisscom is one of globe’s greenest telcos: 100% energy consumption is renewable, company saves more CO2 than it emits.
Suppliers
Ericsson is Swisscom’s largest vendor overall due to its sole supply of the 5G network in Switzerland, and support in other areas (e.g. microwave transport). Huawei has historically been important in fixed broadband and optical transport, but has been shrinking since 2018. Cisco and Nokia have both had big wins in 2021; Samsung, Juniper and Infinera are also significant. Swisscom is actively working with cloud providers in several areas, most significantly with AWS on 5G core cloud. With Huawei’s recent slip, opportunities are open for vendors in multiple domains, especially fixed BB and transmission.
- Table Of Contents
- Charts
- Coverage
- Visuals
Table Of Contents
- Abstract
- Company Overview
- Strategy
- Network Spending
- Suppliers
Charts
- Swisscom revenues by segment, annualized (EUR millions)
- EBIT margin by major operating segment
- Total revenue ($M): Swisscom
- Revenue, share of global total: Swisscom
- Total employees: Swisscom
- Employees, share of global total: Swisscom
- Total capex ($M): Swisscom
- Capex, share of global total: Swisscom
- Annualized capital intensity: Swisscom and peer telcos in Europe
- Labor costs ($M): Swisscom vs. top regional TNOs
- Labor costs as % of opex (ex-D&A), annualized: Swisscom vs. top regional TNOs and regional average
- Annualized labor cost per employee ($K): Swisscom vs. top regional TNOs and regional average
- Annualized EBIT margin (%): Swisscom vs. top regional TNOs and regional average
- FCF/revenues: Swisscom vs. top regional TNOs and regional average
- Net debt ($M): Swisscom vs. top regional TNOs
- Swisscom’s network-related spending (US$M)
- Swisscom’s network-related opex, 2016-20: % of total Opex ex-D&A
- Swisscom’s capex by region/country, 2016-20 (CHF millions)
- Capex by type (CHF millions)
- Key contracts with suppliers
Coverage
Companies and organizations mentioned in this report include the following:
Accenture
Amdocs
AWS
Azure
BT
Cisco
Coriant (now Infinera)
Dell/VMWare
Deutsche Telekom
Ericsson
GCP
HPE
Huawei
IBM/Red Hat
Juniper
KPN
NEC/Netcracker
Nokia
Oracle
Orange
Qualcomm
Samsung
Telefonica
Telenor
TEOCO
Vodafone
Visuals