By Matt Walker
Revenue growth for telco, webscale and carrier-neutral sector will average 1, 10, and 7% through 2025
Telecom network operator (TNO, or telco) revenues are on track for a significant decline in 2020, with the industry hit by COVID-19 even as webscale operators (WNOs) experienced yet another growth surge as much of the world was forced to work and study from home. For 2020, telco, webscale, and carrier-neutral revenues are likely to reach $1.75 trillion (T), $1.63T, and $71 billion (B), amounting to YoY growth of -3.7%, +12.2%, and 5.0%, respectively. Telcos will recover and webscale will slow down, but this range of growth rates will persist for several years. By 2025, the webscale sector will dominate with revenues of approximately $2.51 trillion, followed by $1.88 trillion for the telco sector and $108 billion for carrier-neutral operators (CNNOs).
Network operator capex will grow to $520B by 2025
In 2019, telco, webscale and carrier-neutral capex totaled $420 billion, a total which is set to grow to $520 billion by 2025. The composition will change starkly though: telcos will account for 53% of industry capex by 2025, from 9% in 2019; webscale operators will grow from 25% to 39% in the same timeframe; and, carrier-neutral providers will add 8% of total capex in 2025 from their 2019 level of 6%.
By 2025, the webscale sector will employ more than the telecom industry
As telcos deploy automation more widely and cast off parts of their network to the carrier-neutral sector, their employee base should decline from 5.1 million in 2019 to 4.5 million in 2025. The cost of the average telco employee will rise significantly in the same timeframe, as they will require many of the same software and IT skills currently prevalent in the webscale workforce. For their part, webscale operators have already grown from 1.3 million staff in 2011 to 2.8 million in 2019, but continued rapid growth in the sector (especially its ecommerce arms) will spur further growth in employment to reach roughly 4.8 million by 2025. The carrier-neutral sector’s headcount will grow far more modestly, rising from 90 million in 2019 to about 119 million in 2025. Managing physical assets like towers tends to involve a far lighter human touch than managing network equipment and software.
RECOMMENDATIONS
Telcos: embrace collaboration with the webscale sector
Telcos remain constrained at the top line and will remain in the “running to stand still” mode that has characterized their last decade. They will continue to shift towards more software-centric operations and automation of networks and customer touch points. What will become far more important is for telcos to actively collaborate with webscale operators and the carrier-neutral sector in order to operate profitable businesses. The webscale sector is now targeting the telecom sector actively as a vertical market. Successful telcos will embrace the new webscale offerings to lower their network costs, digitally transform their internal operations, and develop new services more rapidly. Using the carrier-neutral sector to minimize the money and time spent on building and operating physical assets not viewed as strategic will be another key to success through 2025.
Vendors: to survive you must improve your partnership and integration capabilities
Collaboration across the telco/webscale/carrier-neutral segments has implications for how vendors serve their customers. Some of the biggest telcos will source much of their physical infrastructure from carrier-neutral providers and lean heavily on webscale partners to manage their clouds and support new enterprise and 5G services. Yet telcos spend next to nothing on R&D, especially when compared to the 10% or more of revenues spent on R&D by their vendors and the webscale sector. Vendors who develop customized offerings for telcos in partnership with either their internal cloud divisions (e.g. Oracle, HPE, IBM) or AWS/GCP/Azure/Alibaba will have a leg up. This is not just good for growing telco business, but also for helping webscale operators pursue 5G-based opportunities. One of the earliest examples of a traditional telco vendor aligning with a cloud player for the telco market is NEC’s 2019 development of a mobile core solution for the cloud that can be operated on the AWS network; there will be many more such partnerships going forward.
All sectors: M&A is often not the answer, despite what the bankers urge
M&A will be an important part of the network infrastructure sector’s evolution over the next 5 years. However, the difficulty of successfully executing and integrating a large transaction is almost always underappreciated. There is incredible pressure from bankers to choose M&A, and the best ones are persuasive in arguing that M&A is the best way to improve your competitiveness, enter a new market, or lower your cost base. Many chief executives love to make the big announcements and take credit for bringing the parties together. But making the deal actually work in practice falls to staff way down the chain of command, and to customers’ willingness to cope with the inevitable hiccups and delays brought about by the transaction. And the bankers are long gone by then, busy spending their bonuses and working on their next deal pitch. Be extremely skeptical about M&A. Few big tech companies have a history of doing it well.
Webscale: stop abusing privacy rights and trampling on rules and norms of fair competition
The big tech companies that make up the webscale sector tracked by MTN Consulting have been rightly abused in the press recently for their disregard for consumer privacy rights, and overly aggressive, anti-competitive practices. After years of avoiding increased regulatory oversight through aggressive lobbying and careful brand management, the chickens are coming home to roost in 2021. Public concerns about abuses of privacy, facilitation of fake news, and monopolistic or (at the least) oligopolistic behavior will make it nearly impossible for these companies to stem the increased oversight likely to come soon from policymakers. Australia’s pending law, the “News Media and Digital Platforms Bargaining Code,” could foreshadow things to come for the webscale sector, as do recent antitrust lawsuits against Facebook and Alphabet. Given that webscale companies are supposed to be fast moving and innovative, they should get out ahead of these problems. They need to implement wholesale, transparent changes to how they treat consumer privacy and commit to (and actually follow) a code of conduct that is conducive to innovation and competition. The billionaires leading the companies may even consider encouraging fairer tax codes so that some of their excessive wealth can be spread across the countries that actually fostered their growth.
ABOUT THIS REPORT
This report presents MTN Consulting’s first annual forecast of network operator capex. The scope includes telecommunications, webscale and carrier-neutral network operators. The forecast presents revenue, capex and employee figures for each market, both historical and projected, and discusses the likely evolution of the three sectors through 2025. In the discussion of the individual sectors, some additional data series are projected and analyzed; for example, network operations opex in the telco sector. The forecast report presents a baseline, most likely case of industry growth, taking into account the significant upheaval in communication markets experienced during 2020. Based on our analysis, we project that total network operator capex will grow from $420 billion in 2020 to $520 billion in 2025, driven by substantial gains in the webscale and (much less so) carrier-neutral segments. The primary audience for the report is technology vendors, with telcos and webscale/cloud operators a secondary audience.
- Table Of Contents
- Figures & Charts
- Coverage
- Visuals
Table Of Contents
This report is a 43 page long PDF document.
Key sections include:
- Key Findings and Recommendations
- Summary
- Telco Market Forecast
- Webscale Market Forecast
- Carrier-neutral Market Forecast
- Appendix 1: Forecast results
- Appendix 2: About MTN Consulting
Figures & Charts
FIGURES
Figure 1: Revenue prospects for telecom, webscale and carrier-neutral sectors (US$B)
Figure 2: Capex prospects for telecom, webscale and carrier-neutral sectors (US$B)
Figure 3: Fixed, fixed broadband, and mobile subscriber growth versus population (M): 2000-19
Figure 4: Telco revenue and capex relative to GDP metrics
Figure 5: Telco revenues, capex, and labor costs (US$B)
Figure 6: Telecom network operator revenue growth rate, YoY % (fixed exchange rate basis)
Figure 7: Annualized telco revenues through 3Q20 (US$B)
Figure 8: Annualized telco capex (U$SM) since 2014 and YoY growth rates for the last 5 quarters
Figure 9: Labor costs as % of opex ex-D&A, annualized through 2Q20
Figure 10: Telco revenues from 2011-25 (US$B) and YoY % growth
Figure 11: Telco capex from 2011-25 (US$B) and capex/revenue ratio
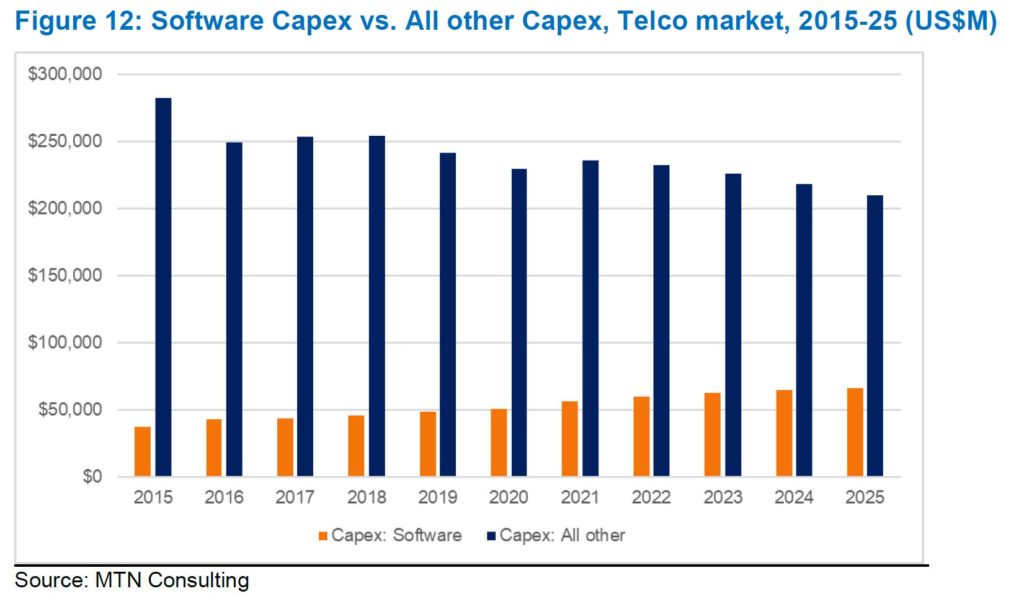
Figure 12: Software Capex vs. All other Capex, Telco market, 2015-25 (US$M)
Figure 13: Labor cost per employee and labor cost as % of opex (ex-D&A), 2011-25
Figure 14: Network-related opex vs. All other opex, Telco market, 2011-25
Figure 15: Webscale operators’ capital intensity ratios, 2019
Figure 16: Revenue splits for Alphabet and Alibaba, 2019
Figure 17: Webscale sector revenues (annualized, US$M) and total headcount, 1Q14-3Q20
Figure 18: Webscale sector R&D and capex spending since 2014
Figure 19: Webscale growth in 3Q20 v. 2011-19 average
Figure 20: Rank of top WNOs based on 3Q20 Network/IT/Software capex
Figure 21: How technology intensive are the key webscale operators?
Figure 22: Webscale sector revenues, 2011-25 (US$M)
Figure 23: Webscale capex and M&A spending, 2011-25 (US$M)
Figure 24: Webscale sector R&D opex, network/IT capex, and all other capex, 2019-25 (US$M)
Figure 25: Webscale sector headcount and revenue per employee, 2011-25
Figure 26: Key players and growth dynamics in the CNNO industry, by segment
Figure 27: Revenues by CNNO type, annual (US$M)
Figure 28: M&A vs. Capex spending, single-quarter (US$M)
Figure 29: Revenue growth rates in 2020 (YTD) v. 2019 for select
Figure 30: CNNOs: Revenue forecast through 2025
Figure 31: CNNOs: Employees and Revenue per employee, 2011-25
Figure 32: CNNOs: Capex and M&A spending, 2011-25 (US$M)
TABLES
Table A-1: Network operator revenues, capex, employees, and M&A spending for 2011, 2015, and 2019-25
Table A-2: Telco market projections through 2025, including actuals for 2011, 2015 and 2019
Table A-2A: Regional breakouts for revenue and capex projections in telco market forecast
Table A-3: Webscale market projections through 2025, including actuals for 2011, 2015 and 2019
Table A-4: Carrier-neutral market projections through 2025, including actuals for 2011, 2015 and 2019
Coverage
This forecast report addresses three large segments of network operators, covering nearly 200 operators in total.
Specific companies or organizations mentioned in the report are as follows:
Affirmed
Alcatel-Lucent
Alibaba
Alphabet
Altiostar
AMD
Ampere
Apple
Arm Semiconductor
AT&T
AWS
Azure
Baidu
BCE
BSNL
BT
Cellnex
China Tower
ChinData
Chorus
CK Hutch
Crown Castle
DataBank
Digital Colony Partners
Digital Realty
eir
Equinix
Ericsson
Facebook
FiberHome
Fujitsu
GCP
GDS Data Centers
GTT Communications
HPE
Huawei
I Squared Capital
IBM
InSite Wireless
Intel
Interxion
INWIT
Jio Platforms
KT
Level 3
Lumen Technologies
Metaswitch
Microsoft
MTNL
NBN Australia
NEC
Nokia
NVIDIA
Oracle
Orange
Packet
Parallel Wireless
Phoenix Tower
Radisys
Rakuten
Reliance Industries
Rogers Communications
Samsung Electronics
SAP
SBA Communications
SingTel
Softbank
Tech Mahindra
Telecom Italia
Telefonica
Telxius
Tencent
Terremark
Time Warner
TSMC
Twitter
Vantage Ventures
Verizon
Vodafone
Yahoo!
Yandex
Zayo
Zoom
ZTE
Visuals