By Matt Walker
The purpose of this report is to provide a compilation of demographic, economic and telecommunications statistics for a large number of countries (167) in a user-friendly format. Users simply select a country of interest on the “Country Profiler” tab, and a series of pre-defined charts appear below. These visuals answer graphically such basic questions as: how big is the country, how fast is it growing, what kind of economy does it have, how interconnected is the country to the world, and what is the penetration rate of telecommunications services. The timeframe covered is 2011-2019.
This is the first version of a report which we expect to evolve over time. The next iteration is likely to allow for multi-country comparisons and also incorporate a wider range of data metrics.
Charts are organized by topic area, as described below.
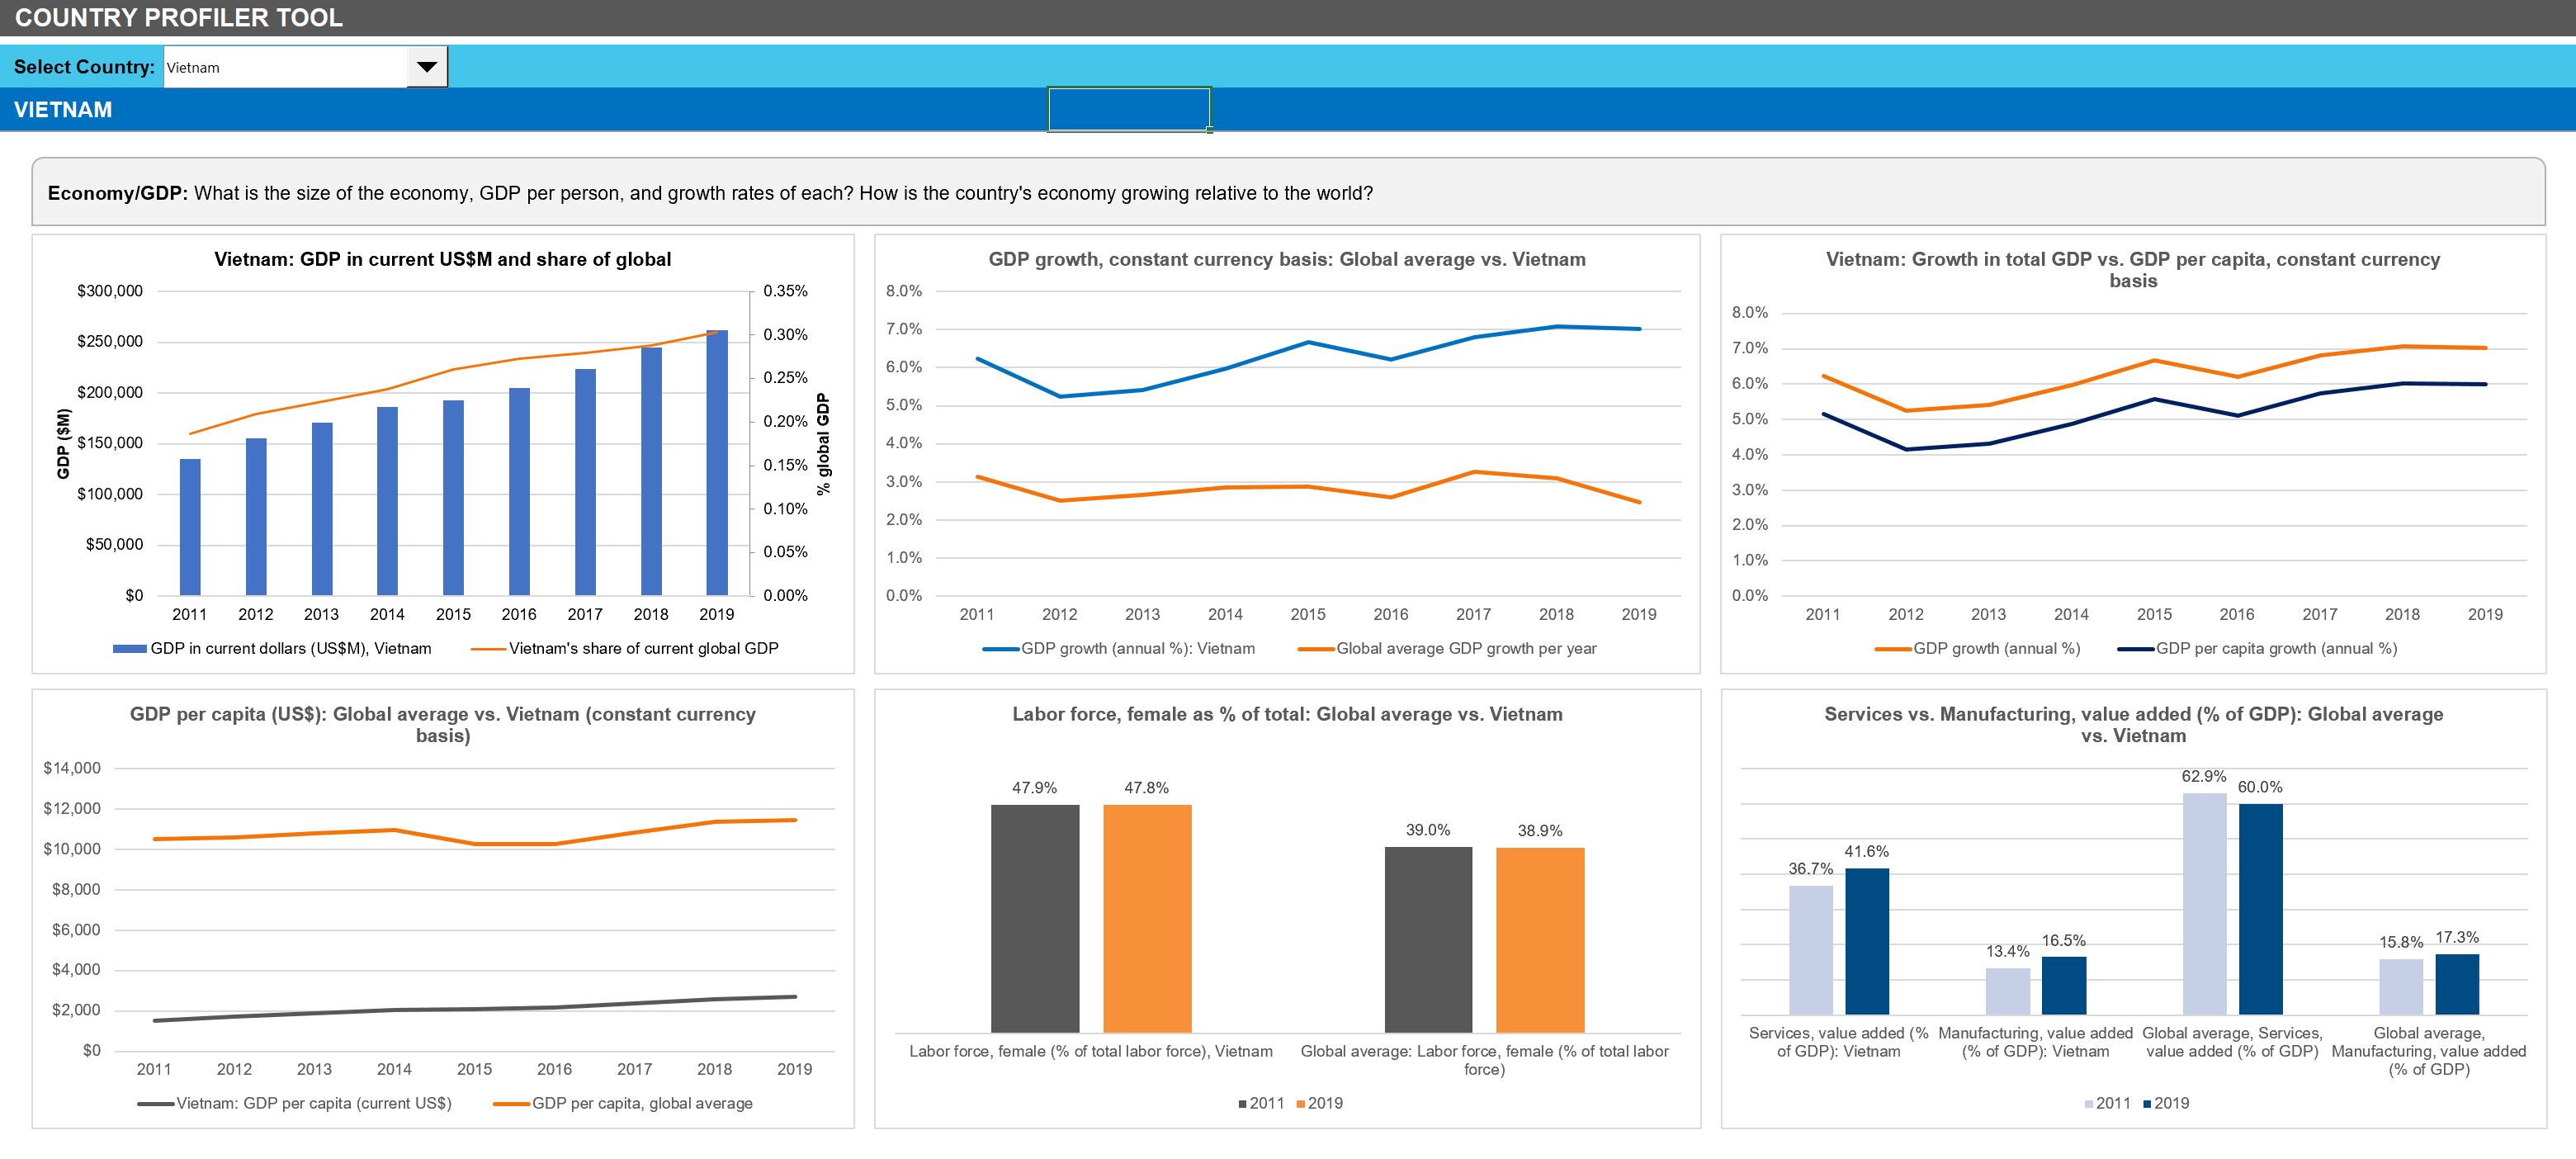
Economy/GDP
Telecom revenues tend to correlate closely with overall GDP, and many studies have shown that telecom network investment is a positive contributor towards economic growth. This section presents the country’s current GDP and percent of the globe; its GDP growth rates compared to global averages; how GDP per capita is growing vs. aggregate GDP; and, how wealthy the country (GDP per capita) relative to the global average. It also summarizes female participation in the labor force, one of many factors considered as a positive in economic development, and the relative sizes of the services and manufacturing sectors in the economy, and how that’s changing. In general, services-oriented economies tend to be much bigger consumers of telecommunications services, including newer types offered by cloud providers.
Trade, FDI and tourism
This series of charts address questions related to the global interconnectedness of the country.
The initial two charts focus on the questions, how significant is trade relative to the global average, and how big a portion of overall trade involves services. Services trading tends to be heavily reliant on telecommunications networks, much more so than manufacturing or agriculture.
This section also addresses how reliant on external investment (FDI) it is for development. High FDI reliance can be a net negative to economic stability given its volatility during downturns, but a high level also tends to be require a solid communications network infrastructure. The final chart addresses tourism: how big is the tourism industry as a percentage of the country’s total exports? Tourists in 2020 require more connectivity than they did in the past, especially on the mobile side. Another important aspect of tourism is that the COVID-19 pandemic has hit tourism-oriented economies especially hard recently. COVID-related downturns are not reflected in this report’s charts, as they end in 2019, but high tourism exposure has often led to especially steep GDP drops in 2020.
Population
For each country included in this report, the first series of charts focus on population. Population stats are an initial indicator of the potential of an economy; longer life spans are better than shorter, but a growing population of older, nonworking people can be a burden on society’s health care and other resources; a younger growing population can indicate growth if life spans are also rising. The relative age distribution can also say something about what sort of telecommunications services may be attractive.
The charts in this section address the questions: what is the country’s population, how is it growing, and how is its share of the world population changing? What is the country’s life expectancy, how is that changing, and how does that compare to global averages? How heavily weighted is the country’s population towards the young (0-14) and old (65+)?
Land, population density, and urbanization
The cost of building networks is vastly different depending on population density and urbanization levels. Further, all else equal, mobile networks have an advantage in markets with low population density due to the cost of installing fixed line infrastructure. This section presents a few stats on the overall land mass covered by the country, the population density and how it’s changing, and the percentage of population residing in both large and small cities.
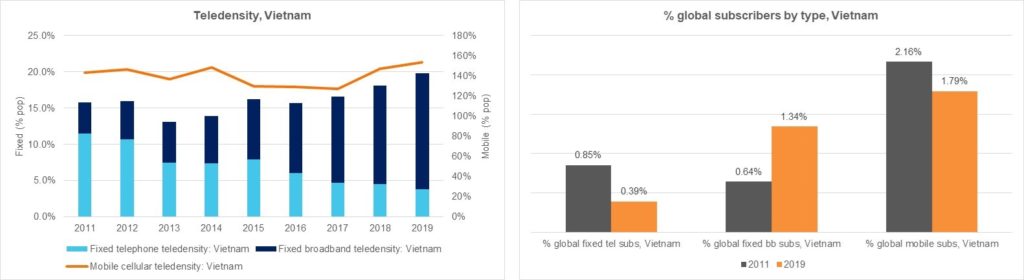
Telecommunications subscribers
This section summarizes the country’s telecommunications penetration rates in three areas: fixed telephony, fixed broadband, and mobile cellular. This section also illustrates the country’s share of the global total in each of these categories, and how that is changing.
Technology and the Internet
This section addresses overall usage of the Internet, as measured in subscriber penetration, and the prevalence of “secure Internet servers” in the country (per a Netcraft survey). It also presents two metrics of how technology-intensive the particular economy is: what share of total manufacured exports are high technology in nature (per the World Bank), and how many R&D researchers are employed within the local economy.
- Table Of Contents
- Charts
- Coverage
- Visuals
Table Of Contents
- Introduction
- Country Profiler
- About
Charts
This report includes a drop-down selector allowing the user to select one of 167 countries and automatically populate a series of charts. The names of the charts are as follows, using as an example the country of Vietnam:
- Vietnam: GDP in current US$M and share of global
- GDP growth, constant currency basis: Global average vs. Vietnam
- Vietnam: Growth in total GDP vs. GDP per capita, constant currency basis
- GDP per capita (US$): Global average vs. Vietnam (constant currency basis)
- Labor force, female as % of total: Global average vs. Vietnam
- Services vs. Manufacturing, value added (% of GDP): Global average vs. Vietnam
- Trade (% of GDP): Vietnam
- Trade in services (% of GDP): Vietnam
- Foreign direct investment, net inflows (% of GDP): Vietnam
- International tourism, receipts (% of total exports): Vietnam
- Vietnam: Total population (millions) and % global
- Life expectancy at birth: Global average vs. Vietnam (years)
- Population of young (0-14) and old (>65) as percent of total: Global average vs. Vietnam
- Land mass & Population: Vietnam’s share of globe
- Population density: Vietnam vs. global average
- Rural population as % total: Global average vs. Vietnam
- Distribution of urban population by city size in Vietnam
- Telecommunications subscribers, Vietnam (M)
- Teledensity, Vietnam
- % global subscribers by type, Vietnam
- Vietnam: Individuals using the Internet (% of population)
- Vietnam: Secure Internet servers (per 1 million people)
- Vietnam: High-technology exports (% of manufactured exports)
- Vietnam: Researchers in R&D (per million people)
Coverage
Countries included in this report are as follows:
Afghanistan
Albania
Algeria
Angola
Argentina
Armenia
Australia
Austria
Azerbaijan
Bahrain
Bangladesh
Belarus
Belgium
Benin
Bhutan
Bolivia
Bosnia and Herzegovina
Botswana
Brazil
Brunei
Bulgaria
Burkina Faso
Burundi
Cabo Verde
Cambodia
Cameroon
Canada
Central African Republic
Chad
Chile
China
Colombia
Democratic Republic of the Congo
Republic of Congo
Costa Rica
Cote d’Ivoire
Croatia
Cyprus
Czech Republic
Denmark
Djibouti
Dominican Republic
Ecuador
Egypt
El Salvador
Equatorial Guinea
Eritrea
Estonia
Eswatini
Ethiopia
Fiji
Finland
France
Gabon
The Gambia
Georgia
Germany
Ghana
Greece
Guatemala
Guinea
Guinea-Bissau
Guyana
Haiti
Honduras
Hong Kong
Hungary
Iceland
India
Indonesia
Iran
Iraq
Ireland
Israel
Italy
Jamaica
Japan
Jordan
Kazakhstan
Kenya
South Korea
Kosovo
Kuwait
Kyrgyz Republic
Laos
Latvia
Lebanon
Lesotho
Liberia
Libya
Lithuania
Luxembourg
Macao
Madagascar
Malawi
Malaysia
Maldives
Mali
Malta
Mauritania
Mauritius
Mexico
Moldova
Mongolia
Montenegro
Morocco
Mozambique
Myanmar
Namibia
Nepal
Netherlands
New Zealand
Nicaragua
Niger
Nigeria
North Macedonia
Norway
Oman
Pakistan
Panama
Papua New Guinea
Paraguay
Peru
Philippines
Poland
Portugal
Puerto Rico
Qatar
Romania
Russia
Rwanda
Saudi Arabia
Senegal
Serbia
Sierra Leone
Singapore
Slovak Republic
Slovenia
Somalia
South Africa
South Sudan
Spain
Sri Lanka
Sudan
Suriname
Sweden
Switzerland
Syria
Taiwan
Tajikistan
Tanzania
Thailand
Timor-Leste
Togo
Trinidad and Tobago
Tunisia
Turkey
Turkmenistan
Uganda
Ukraine
UAE
UK
USA
Uruguay
Uzbekistan
Venezuela
Vietnam
Yemen
Zambia
Zimbabwe
Visuals