By Matt Walker
Summary
Webscale capex hit an all-time high in 2Q20, but the opposite happened in telecom. Telco capex in 2Q20 amounted to $65.5B, down 6.2% from the 2Q19 period. That pushed telco capex on an annualized basis down to $285.6 billion, the lowest point in at least a decade. Vendors selling into the telecom sector felt this pain. Setting aside Huawei, whose 2Q20 revenues soared on the back of Chinese 5G builds, the rest of the vendor industry saw telco sales drop 5.3% in 2Q20.
The spread of COVID-19 has caused massive economic dislocations across the world, and the telecom sector was not immune. However, in profitability terms, 2Q20 was a good quarter for telcos, just as it was for the webscale players. While negative growth rates were the norm in 2Q20 for telecom, the bottom line wasn’t all that bad. Estimated EBITDA for the telco sector fell 2.8% in 2Q20 YoY, and EBIT dropped 4.1% on average. Since revenues declined at the faster 5.4% clip in 2Q20 on a YoY basis, overall margins improved on both an EBITDA and EBIT basis. Some of the margin improvement is due to telcos’ leveraging demand growth for fixed broadband and services aimed at remote workers. Many telcos reported improvements in their fixed line operations, with Telecom Italia noting an “inversion” in the fixed to mobile substitution effect. However, as noted, overall revenues did fall 5.4% YoY, so profit growth was more about cost control.
Reduced headcount is one possible explanation. Telcos employed 5.11 million at the end of June 2020, from 5.21 million a year earlier. Earnings reports show, however, that labor costs rose again in 2Q20, on a relative basis: from 23.5% in 2Q19, labor costs were 24.3% of opex (ex-D&A) on an annualized basis in 2Q20. Many telcos pointed to reductions in marketing expenses, as demand for new services slowed to a halt. They also cited sales opex drops, as retail outlets closed and both selling & customer support shifted to digital platforms. Customer churn declined for many mobile operators, as did the cost of acquiring new customers. Programming expenses fell for telcos delivering media services (no live sports, limited new pre-recorded content). The overriding factor, though, is telcos’ efforts to digitize, which COVID-19 provided a reason to accelerate. That has implications for the network, where automation tools are becoming crucial, and for other internal processes and customer interactions.
In this climate, the outlook for capex will remain tight: COVID-19 remains prevalent in many countries, there is still a global recession underway, the shape of any recovery is unclear, and telcos really don’t want to spend more capex than they need to. Adoption of 5G took a pause in 1H20 and most telcos still look at it cautiously pending verification of new business models. The combination of COVID-19 and Huawei’s problems have set back the global progression to 5G by at least a year. However, the shift towards digitization will accelerate, and vendors delivering software- and cloud native-based functionality to telcos will benefit. Platforms like Azure for Operators, AWS Wavelength, and Google’s Mobile Edge Cloud will see increased adoption by telcos. We may see capex fall further in 2021 towards the 15% of revenues range as webscale providers become important collaborators with telcos on the network side. Asset spinoffs to the carrier-neutral sector further support a low capex profile for telcos.
- Table Of Contents
- Figure & Charts
- Coverage
- Visuals
Table Of Contents
- Summary (p2)
- Telecom shrinks in 2Q20 as both revenues and capex drop (p2)
- Modest uptick in profitability despite pandemic (p4)
- Cost control and digitization (p5)
- Outlook for 2H20 and 2021 (p6)
- Appendix (p8)
Figure & Charts
Figures
Figure 1: Telco capex by region: 2Q18-2Q20 (single quarter basis)
Figure 2: Top 20 telcos based on 2Q20 capex ($M)
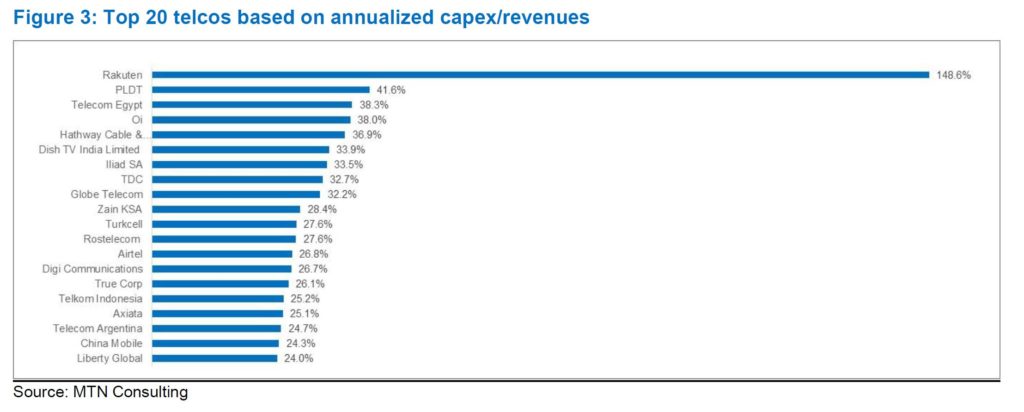
Figure 3: Top 20 telcos based on annualized capex/revenues
Figure 4: Annualized operating profit (EBIT) margin for the TNO-50
Figure 5: Telco capex and annualized capital intensity in the second quarter, 2015-20
Coverage
Organizations mentioned in this report include:
Altice USA
Amazon (AWS)
America Movil
AT&T
China Mobile
China Telecom
China Unicom
Chunghwa Telecom
Comcast
Deutsche Telekom
FiberHome
Google
Hathway Cable
Huawei
Jio
KDDI
KT
Microsoft (Azure)
NTT
Oi
Orange
PLDT
Rakuten
Singtel
SK Telecom
Telecom Egypt
Telecom Italia
Telefonica
Telenor
Telstra
T-Mobile
Verizon
Vodafone
ZTE
Visuals