This is MTN Consulting’s comprehensive, Excel-based assessment of the Carrier-Neutral Network Operator (CNNO) market sector, including detailed financial & operational results from 2011 through December, 2019 (4Q19).
Tower CNNOs covered include: American Tower, Bharti Infratel, Cellnex, China Tower, Crown Castle, EI Towers, GTL Infrastructure, Inwit, Balitower, Inti Bangun Sejahtera, Sarana Menara Nusantara, Solusi Tunas Pratama, Tower Bersama Infrastructure, SBA Communications, Arqiva, TDF Infrastructure/Arcus, Telesites, Telxius/Telefonica.
Data center CNNOs: CoreSite Realty, CyrusOne, Digital Realty, DuPont Fabros, Equinix, Interxion, QTS Realty, Switch, GDS Data Centers.
Bandwidth CNNOs: Chorus Limited, Cogent, Internap, Level 3, Lumos, NBN Australia, Superloop, Uniti Group, GTT Communications, and Zayo
- Table of Contents
- Figure & Charts
- Visuals
Table of Contents
- Abstract
- CNNO Segment Overview
- Analysis
- Operating Metrics
- Key Stats thru 4Q19
- Segment Drilldown
- Company Drilldown
- Company Benchmarking
- Raw Data
- Exchange Rates
- About
Figure & Charts
- Revenues by CNNO type (US$M)
- Revenues single-quarter (US$M)
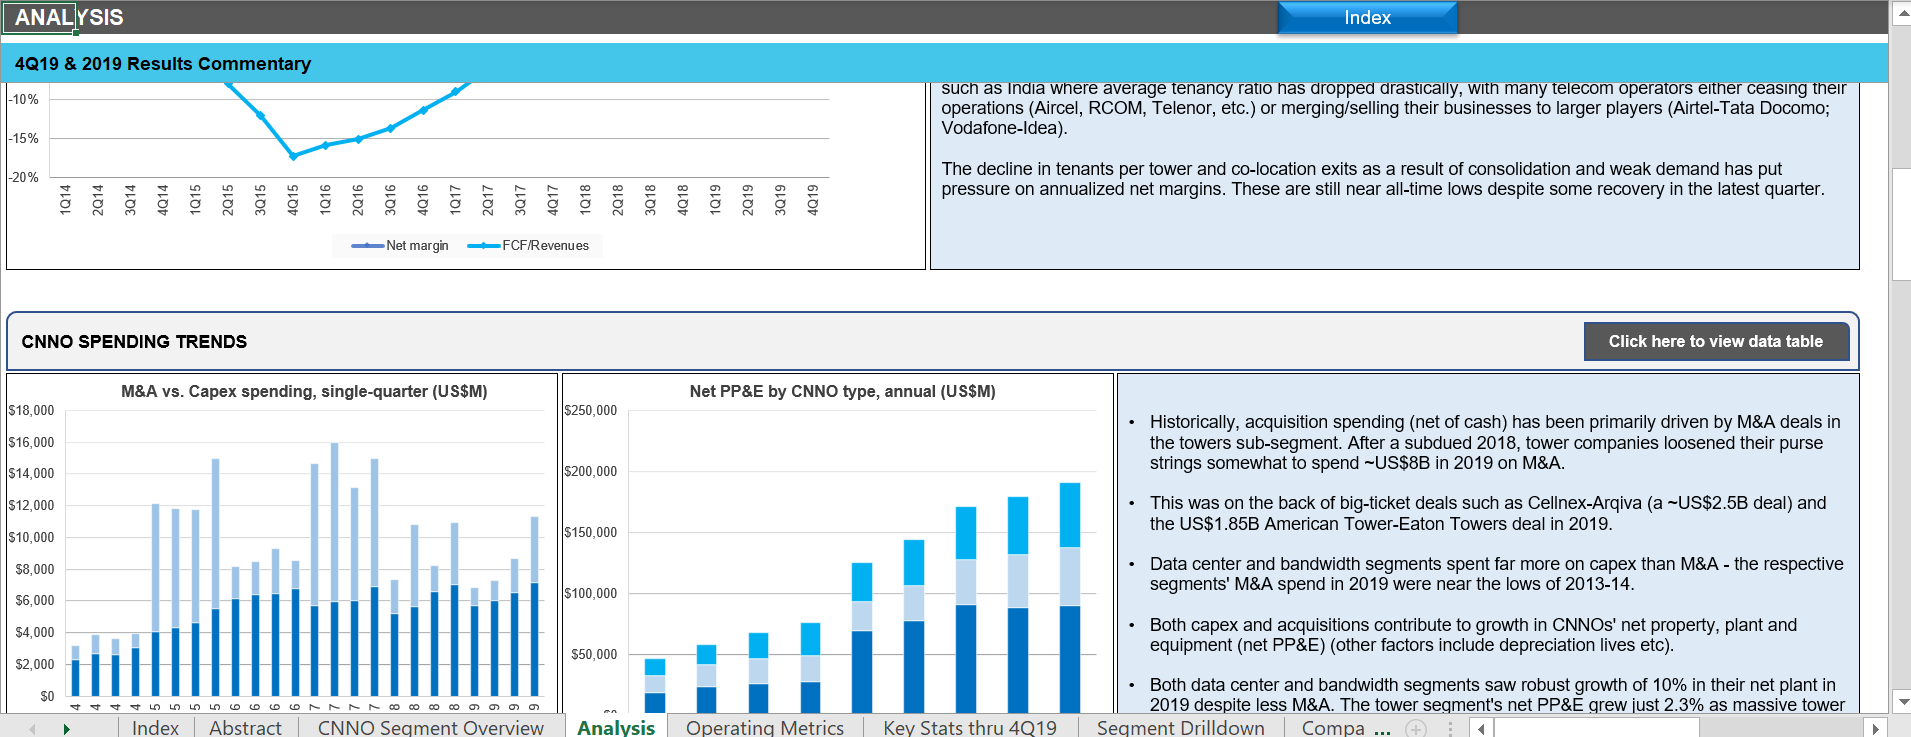
- CNNO Profitability, annualized (%)
- Capex & M&A spending, single-quarter (US$M)
- Net PP&E by CNNO type (US$M)
- Number of data centers & NRSF per data center (K)
- Bandwidth fiber route miles, Global
- CNNO towers & average tenancy ratio
Below charts by total CNNO market, CNNO sub-segments, and by companies:
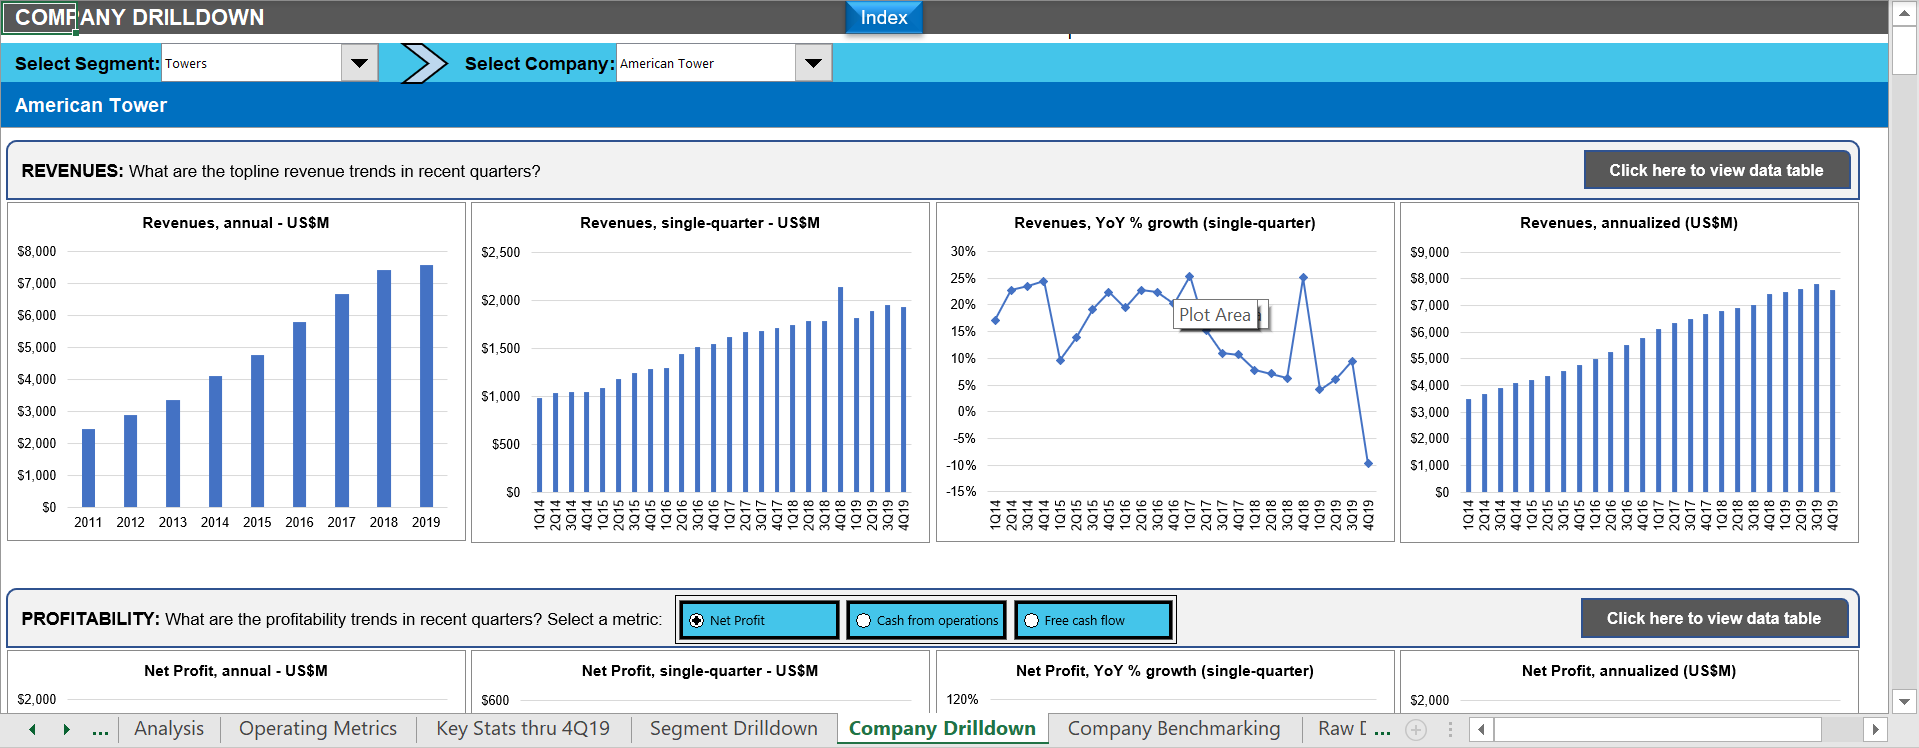
- Revenues: annual, single-quarter, and annualized (US$M)
- Profitability (Net Profit; Cash from operations; Free cash flow): annual, single-quarter, and annualized (US$M)
- Spending (M&A; Capex): annual, single-quarter, and annualized (US$M)
- Cash & Short-term Investments: annual and single-quarter (US$M)
- Debt (Total debt; Net debt): annual and single-quarter (US$M)
- Property, Plant & Equipment: annual and single-quarter (US$M)
- Key Ratios: Net margin; Capex/revenues; M&A/revenues; Free cash flow/revenues
- Total employees
- Revenue per employee, annualized (US$K)
- FCF per employee, annualized (US$K)
- Net PP&E per employee, annualized (US$K)
Company benchmarking charts:
- 2011 vs. 2019: company benchmark by KPI (Revenues, Net profit, Cash from operations, Capex, Free cash flow, Cash & short-term investments, Net PP&E, Total debt)
- 2011 vs. 2019: company benchmark by key ratio (Capex/revenues; Net margin; FCF margin)
- Top 5 CNNOs by sub-segment: by KPI (Revenues, Net profit, Cash from operations, Capex, Free cash flow, Cash & short-term investments, Net PP&E, Total debt)
- Top 5 CNNOs by sub-segment by Key ratio: Capex/revenues; Net margin; FCF margin
Visuals