By Arun Menon
The world’s largest technology companies are investing heavily in webscale networks. These are centered around enormous webscale, also known as “hyperscale” data centers, and the web of infrastructure connecting them. That includes optical interconnects between data centers, submarine cables in the core, and various customer access technologies including satellite and home-grown innovations like the Terregraph and Loon projects from Facebook and Google, respectively.
This webscale network operator (WNO) sector of companies spent $114.7B for the twelve-months ending 2Q20, or 7.5% of revenues. Nearly half of WNO capex is for the network (including capitalized software). Webscale operators spend even more on R&D each year than capex; annualized webscale R&D expenses in 2Q20 were 11.4% of revenues. This is in contrast to telecom operators, who rarely spend over 1% of revenues on R&D. WNOs use their R&D smarts to design their own network and equipment. Each company has its own approach, though. As the WNO sector grows, it is important to understand how WNOs blend internal expertise with procured technology from outside vendors to build their networks. Technology partnerships are crucial, as webscale providers generally prefer new, customized solutions to off the shelf alternatives. In addition, webscale operators are increasingly leveraging partnerships with other types of network operators, notably telcos, in order to assemble a complete network solution.
MTN Consulting’s “Webscale Network Supply Chain Analyzer” tracks technology spending in this sector by digging deep into the webscale-related supply chains of each operator. The Analyzer tracks contracts/deals between WNOs and technology vendors/partners across eight product categories, and provides detail on type of relationship and nature of deal. The goal is to provide a comprehensive view of the competitive landscape facing vendors who aim to sell or partner with webscale operators.
In total, this database includes 648 entries through the middle of August 2020. Contracts are concentrated in the 2016-20 period but stretch back to 2010. The vast majority of contracts involve one of the top 8 WNOs, who account for ~80% of total WNO capex. More companies are building webscale networks over time, though, and more vendors are selling to them. Our coverage will evolve with the sector.
File format: Excel
- Table of Contents
- Figure & Charts
- Coverage
- Visuals
Table of Contents
Index
- Table of Contents
- Terms of Use
Abstract
Quarterly view:
- Contracts Summary
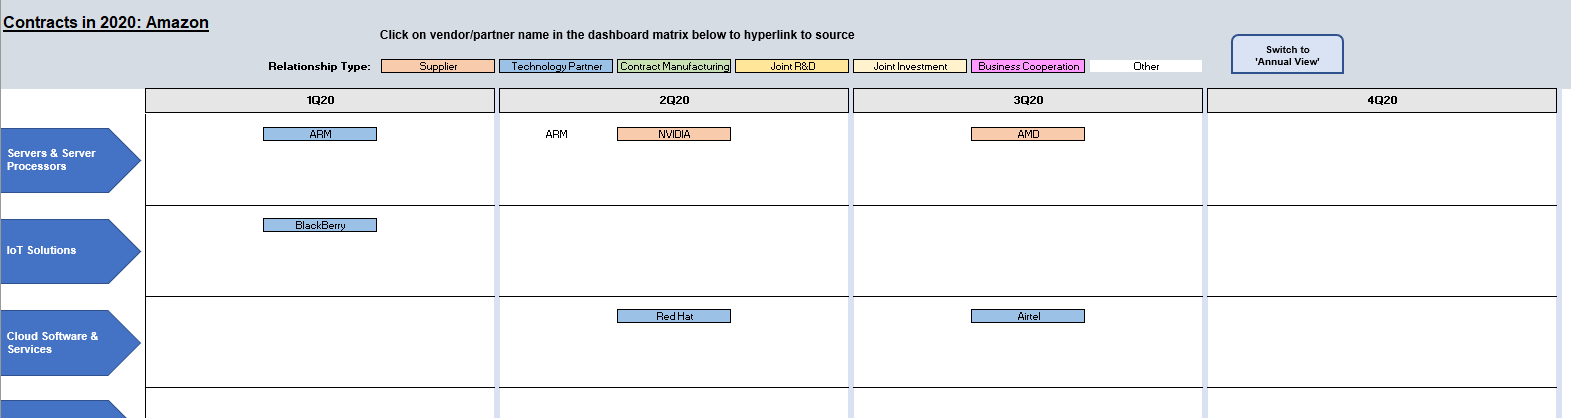
- Contracts Dashboard Matrix
- Contracts Data Table – All Contracts
Annual view:
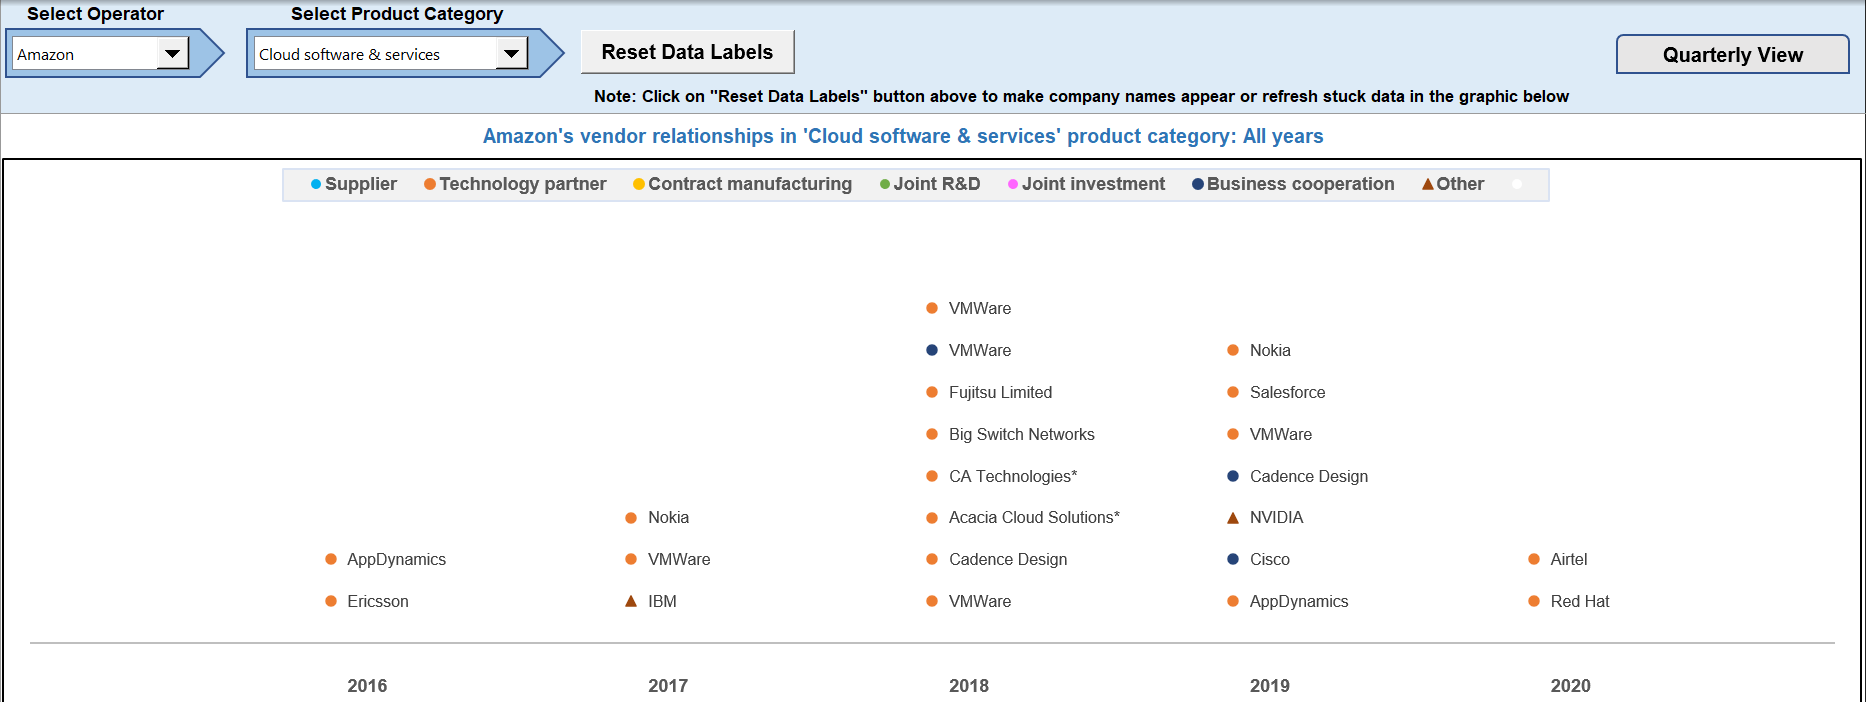
- Historical timeline of vendor relationships for a selected product category
- Data Table
Key Vendor/Partner Breakout:
- Key WNO relationships by a selected vendor/partner
- Data Table
About
- Global Network Infrastructure (GNI) Tracker
- Network Operator Coverage
- Methodology
- Coverage
Figure & Charts
- Capex and vendor contracts, 2011-2020
- Contracts by product: all years
- Top vendors, all years
- Contracts by quarter
- Dashboard matrix – Quarterly view
- Dashboard matrix – Annual view
- Key Vendor – WNO relationships, all years
Coverage
| WNO Companies | |
| Alibaba | Alphabet/Google |
| Amazon | Apple |
| Baidu | |
| Fujitsu | IBM |
| JD.com | Microsoft |
| Oracle | Tencent |
| Top Vendor Companies | ||||
| AMD | Arista Networks | ARM | Barefoot Networks | Big Switch Networks |
| Broadcom | Cadence Design | Cisco | Dell Technologies | Ericsson |
| F5 Networks | Finisar | Foxconn (Hon Hai) | Huawei | IBM |
| Infineon Technologies | Inspur | Intel | Inventec | Marvell Technology |
| Mediatek | Mellanox | Murata | Nokia | NVIDIA |
| NXP Semiconductors | Qualcomm | Quanta | Samsung | TSMC |
| TE Connectivity | VMWare | Wistron | Xilinx | |
Visuals