By Matt Walker
Axiata is a Malaysia-based multinational mobile operator with presence in 11 Asian markets. Axiata provides digital telco services to mobile, home and enterprise customers; digital financial services, digital advertising, and digital platforms; and its cell tower unit provides infrastructure solutions and services.
Axiata’s main mobile operating companies (OpCos) are: Robi (Bangladesh), Smart (Cambodia), XL (Indonesia), Celcom (Malaysia), Ncell (Nepal), and Dialog (Sri Lanka).
Axiata also has a presence in Laos, Myanmar, Pakistan, Philippines, and Thailand, partly through its cell tower subsidiary, edotco, which owns 21,521 towers across 7 Asian markets, and manages an additional 11,212 towers on behalf of others. Axiata’s digital businesses include Boost, Aspirasi, ADA (analytics, data, advertising), and Apigate.
In the 3Q20 annualized period, Axiata’s group revenues totaled 24.21 billion Ringgit (RM), down 1.5% YoY. Capex for the same four quarters was 5.57B RM, down 11.1% YoY. Capital intensity equates to 23.0%, higher than the average capital intensity of 18.7% for Asian telcos in the same period.
Focusing on operating costs, spending on employees (labor costs) amounted to 2.22B RM for 3Q20 annualized, down 2.6% YoY. Annualized total opex, excluding depreciation & amortization, was 13.46B RM in 3Q20, down at the much steeper rate of 10.7% YoY. The expense categories of domestic interconnect, international outpayment, and “other” operating costs have been the drivers for the opex reduction. Labor costs amount to roughly 16.5% of Opex ex-D&A, much lower than the global average of 24.1%.
Network infrastructure
As of the end of 3Q20, Axiata’s main mobile operating companies (“OpCos”) had approximately 153.6 million mobile subscribers spread across a range of services and technology platforms, and with a mix of pre-paid and post-paid plans. Nearly 70% of its subscriber total comes from two markets, Indonesia (37%) and Bangladesh (32.6%). Axiata’s “domestic” Malaysian unit, Celcom, accounted for just 6% of subscribers but is far more significant than low-ARPU Bangladesh on a profitability basis: Celcom accounted for 23% of EBITDA for the first 9 months of 2020, versus Robi’s 15%. Managing the costs of its various overseas OpCos is a big strategic challenge for Axiata, and infrastructure is at the center of this effort.
Axiata’s network infrastructure consisted of the following:
Towers:
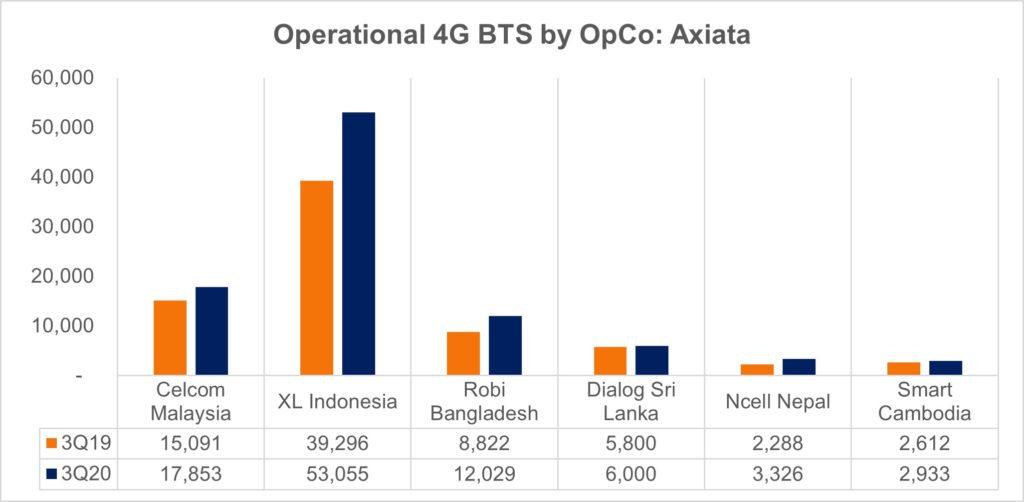
-Axiata’s OpCos do not provide a consistent breakdown of sites by radio capability, however, its 6 main OpCos reported a total of 95,196 4G BTS at the end of 3Q20, up from 73,908 in 3Q19 and 59,169 at year-end 2018. In addition, Axiata’s tower subsidiary edotco owned 21,521 towers across 7 markets in 3Q20 (3Q19: 19,991), and managed an additional 11,212 sites on behalf of others (primarily Axiata OpCos).
Fiber:
-for intersite transmission, backbone capacity, and other purposes, Axiata tends to rent fiber or capacity from incumbent fixed operators and other providers in each country, and deploys microwave as much as possible to avoid these costly rented facilities. In general, Axiata OpCo shareholders do not include companies with fiber resources of their own in the respective country, which might otherwise lead to preferential network rental agreements.
-XL unit in Indonesia is a special case. It has a large optical backbone (45,000km), which XL is expanding (+2500km in 2019), in part to link base stations with fiber. XL is also deploying an FTTH network which passed ~470K homes as of Sep. 2020.
Data centers:
-5 of its 6 OpCos have some data center footprint, with XL Axiata’s DC infrastructure the most developed. XL is developing a carrier-neutral data center operator in Indonesia in concert with the Princeton Digital Group.
Network spending
For the annualized period ended 3Q20, Axiata’s spending on network infrastructure included the following:
–>Network operations opex: $558M total. This includes roughly 52% recorded as Repairs & Maintenance, and 48% in internal staff costs.
–>Telecom equipment capex: $1,120M, associated with additions to the “Telecommunication network equipment” category on Axiata’s balance sheet. This category includes some capitalized labor, likely about 10-20% of the total, which can include labor from external vendors, subcontractors for specific network projects, and Axiata employees.
–>Software capex: $137M, associated with the “Computer support systems” category on Axiata’s balance sheet.
Relative to total opex excluding depreciation & amortization, network operations has ranged from 17-19% in recent quarters. This is lower than many operators, but requires some context. In its key markets, Axiata faces relatively high levels of both license fees (mainly for spectrum) and network rental fees. In CY2019, for instance, license fee and network rental operating expenses amounted to 14.9% and 13.5% of corporate revenues in Indonesia, respectively.
Telecom equipment capex accounts for the vast majority of Axiata’s recorded capex, and amounted to 19.5% of revenues for the 4 quarters ended 3Q20. Software capex is growing as a percent of total, however, totaling 2.4% of revenues over the last four quarters, from 1.7% in CY2018.
Suppliers
Huawei and Ericsson are easily Axiata’s largest suppliers, working with various Axiata OpCos on multiple generations of radio access equipment, transport networks (optical and microwave), and services. Additional key vendors include NEC and Infinera in the transport domain, and Cisco in the mobile core. Some vendors are strong only at specific OpCos, such as VMWare with Dialog; one factor in this is the different service mix among the OpCos, with some offering enterprise and fixed services, not just mobile. Axiata’s most significant single contract is probably XL’s multi-year managed services project with Huawei; for the 2016-18 period, Huawei recorded an average of just under $100M per year from XL for this single engagement.
This is an 8 tab Excel-based report.
- Table Of Contents
- Charts
- Coverage
- Visuals
Table Of Contents
- Abstract
- Company Overview
- Network Infrastructure
- Network Strategy
- Network Spending
- Network Suppliers
- About
Charts
- Total revenue ($M): Axiata
- Revenue, YoY % change: Axiata
- Revenue, share of global total: Axiata
- Total capex ($M): Axiata
- Capex, YoY % change: Axiata
- Capex, share of global total: Axiata
- Annualized revenue by country market(s), in millions of Malaysian Ringgit
- Annualized capital intensity by country market(s): Axiata
- Capital intensity: Axiata versus regional peers
- Total employees: Axiata
- Axiata’s share of total TNO employees in its region and the global telco market
- Labor costs as % of opex (ex-D&A), annualized: Axiata vs. top regional TNOs and regional average
- Annualized labor costs per employee ($K): Axiata vs. top regional TNOs and regional average
- Operational 4G BTS by OpCo: Axiata
- edotco’s owned towers and sites under management by country, 3Q20
- Data center footprint/strategy: Axiata
- PP&E and RoU assets on books at year-end 2019, net (US$M)
- Network spending, annualized (US$M): Axiata
- Network operations as % of total opex ex-D&A
- Network infrastructure capex as % of revenues, annualized
- Axiata’s key suppliers
Coverage
Companies and organizations mentioned in this report include the following:
365squared
Accenture plc
Amazon Web Services
Amdocs
Apigate
Aspirasi
Bharti Airtel
Boost
Celcom
Cisco Systems
Dialog
Ericsson
Fortumo
Gemtek
Google Cloud
Huawei
IBM
Idea
Infinera
Juniper Networks
M1
Mitsui
Ncell
NEC Corporation
Nokia
NTT Communications
Parallel Wireless
Princeton Digital Group
Qvantel
Robi
SAP
Smart
Southern Coast Ventures
Spirent
Tata Communications
Tech Mahindra
Telecom Infra Project
Telenor
VMWare
XL Axiata
ZTE
Visuals